Figures & data
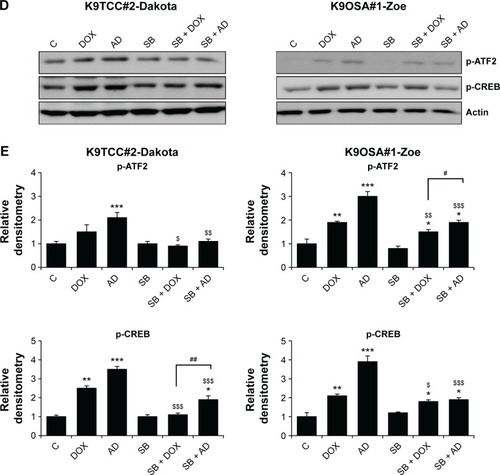
Figure 1 Morphology of tested K9TCC and K9OSA cell lines.
Notes: (A) Chemical structures of the DOX and N-benzyladriamycin-14-valerate (AD198) molecules. (B) Representative images of tested K9TCC#1-Lillie, K9TCC#2-Dakota, K9TCC#4-Molly, K9OSA#1-Zoe, K9OSA#2-Nashville, K9OSA#3-JJ cells’ morphology taken by a phase-contrast microscope. Objective 20× with scale bar 50 μm.
Abbreviations: DOX, doxorubicin; K9OSA, canine osteosarcoma; K9TCC, canine transitional cell carcinoma.
Abbreviations: DOX, doxorubicin; K9OSA, canine osteosarcoma; K9TCC, canine transitional cell carcinoma.
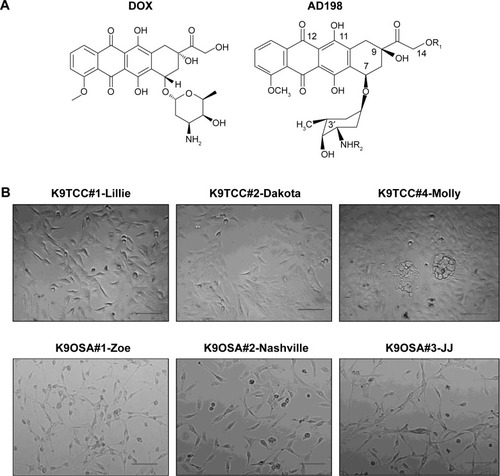
Table 1 Doubling times for tested K9TCC and K9OSA cell lines
Table 2 IC50 values of DOX and AD198 of tested K9TCC and K9OSA cell lines
Figure 2 DOX- and AD198 (AD)-inhibited cell viability of tested K9TCC and K9OSA cell lines.
Notes: (A) K9TCC#1-Lillie, K9TCC#2-Dakota, and K9TCC#4-Molly and (B) K9OSA#1-Zoe, K9OSA#2-Nashville, K9OSA#3-JJ cells were treated with DOX (dark bars) and AD (white bars) at 0, 0.1, 0.5, and 1 μM for 48 hours and compared to control groups. Cell proliferation was determined by MTS assay and relative cell growth rate was normalized to control groups. Values represent mean ± standard error (n=16) of four replicates from four independent experiments. Paired Student’s t-tests comparing DOX treatment to control (#P<0.05, ##P<0.01, ###P<0.001), AD treatment to control ($P<0.05, $$P<0.01, $$$P<0.001), and AD to DOX treatment groups with the same dose treatment (*P<0.05, **P<0.01, ***P<0.001) were used.
Abbreviations: AD, AD198; DOX, doxorubicin; K9OSA, canine osteosarcoma; K9TCC, canine transitional cell carcinoma; MTS, 3-(4,5-dimethyl-2-yl)-5-(3-carboxymethoxyphenyl)-2-(4-sulfophenyl)-2H-tetrazolium.
Abbreviations: AD, AD198; DOX, doxorubicin; K9OSA, canine osteosarcoma; K9TCC, canine transitional cell carcinoma; MTS, 3-(4,5-dimethyl-2-yl)-5-(3-carboxymethoxyphenyl)-2-(4-sulfophenyl)-2H-tetrazolium.
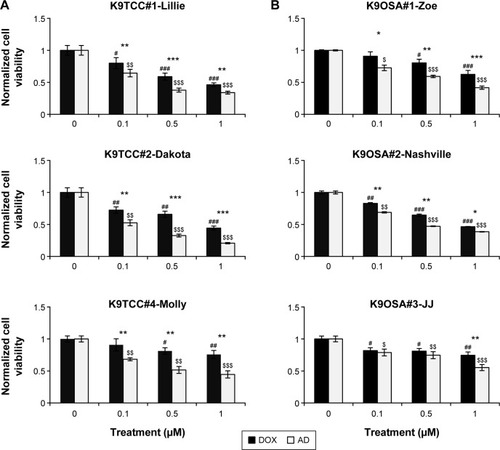
Figure 3 AD198 (AD)- and DOX-induced apoptosis and caspase activation in tested K9TCC and K9OSA cell lines in vitro.
Notes: (A) K9TCC#2-Dakota and K9OSA#1-Zoe cells were treated with 1 μM DOX and 1 μM AD for 24 hours and induced apoptosis was measured using the TACS Anexin V-FITC assay using a flow cytometer. Relative apoptotic activities were normalized to control groups. Values represent mean ± standard error (n=9) of three replicates of three independent experiments. Paired Student’s t-tests comparing treatment to control groups (*P<0.05, **P<0.01, ***P<0.001) and comparing among DOX and AD treatment groups (##P<0.01, ###P<0.001) were used. (B) K9TCC#2-Dakota and K9OSA#1-Zoe cells were treated with 1 μM DOX and 1 μM AD for 24 hours and caspase activities were measured using the Caspase-Glo 3/7 luminescence assay. Relative caspase activities were normalized to control. Values represent mean ± standard error (n=6) of two replicates of three independent experiments. Paired Student’s t-tests comparing treatment to control (***P<0.001) and comparing among DOX and AD treatments (##P<0.01) were used. (C) K9TCC#2-Dakota and K9OSA#1-Zoe cells were treated with 1 μM DOX and 1 μM AD for 24 hours. The expressions of PARP(CF) were evaluated by WB analysis. Actin was used as loading control. The results are representative of three independent experiments (n=3). (D) Densitometry evaluation of PARP protein bands from WB analysis was done using ImageJ software. Values represent the mean of measured densitometry of each protein’s band from two replicates of three independent experiments ± standard error (n=6). Paired Student’s t-tests were used to compare controls to DOX and AD treatments (*P<0.05, ***P<0.001) and to compare DOX to AD treatment (##P<0.01).
Abbreviations: AD, AD198; PARP(CF), PARP-cleaved fragment; DOX, doxorubicin; K9OSA, canine osteosarcoma; K9TCC, canine transitional cell carcinoma; PARP, poly (ADP-ribose polymerase); PARP(T), total PARP; WB, Western blot.
Abbreviations: AD, AD198; PARP(CF), PARP-cleaved fragment; DOX, doxorubicin; K9OSA, canine osteosarcoma; K9TCC, canine transitional cell carcinoma; PARP, poly (ADP-ribose polymerase); PARP(T), total PARP; WB, Western blot.
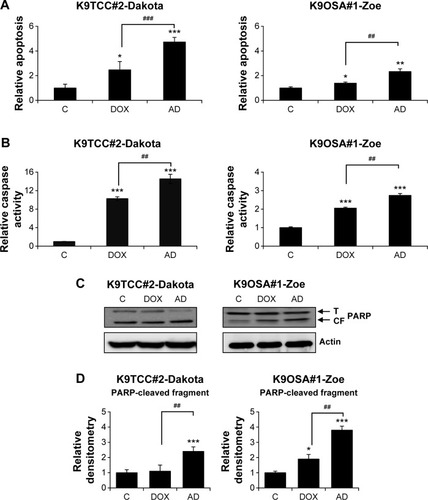
Figure 4 AD198 (AD) and DOX activated the PKC-δ pathway in tested K9TCC and K9OSA cell lines.
Notes: K9TCC#2-Dakota and K9OSA#1-Zoe cells were treated with 1 μM DOX and 1 μM AD for 24 hours. (A) CREB, PKC-δ (CF), p-p38, p38, p-CREB, p-ATF2, and CREB protein levels were detected by WBs. Actin was used as loading control. The results are representative of three independent experiments (n=3). (B) Densitometry evaluation of PKC-δ (CF), p-p38, p-ATF2, and p-CREB protein bands from WB analysis was done using ImageJ software. Values represent the mean of measured densitometry of each protein’s band from two replicates of three independent experiments ± standard error (n=6). Paired Student’s t-tests were used to compare controls to DOX and AD treatments (*P<0.05, **P<0.01, ***P<0.001) and to compare DOX to AD treatment (##P<0.01).
Abbreviations: AD, AD198; ATF2, activating transcription factor 2; PCK-δ (CF), cleaved fragment of PKC-δ; CREB, cyclic AMP response element binding protein; DOX, doxorubicin; K9OSA, canine osteosarcoma; K9TCC, canine transitional cell carcinoma; PKC-δ, protein kinase C-delta; WB, Western blot.
Abbreviations: AD, AD198; ATF2, activating transcription factor 2; PCK-δ (CF), cleaved fragment of PKC-δ; CREB, cyclic AMP response element binding protein; DOX, doxorubicin; K9OSA, canine osteosarcoma; K9TCC, canine transitional cell carcinoma; PKC-δ, protein kinase C-delta; WB, Western blot.
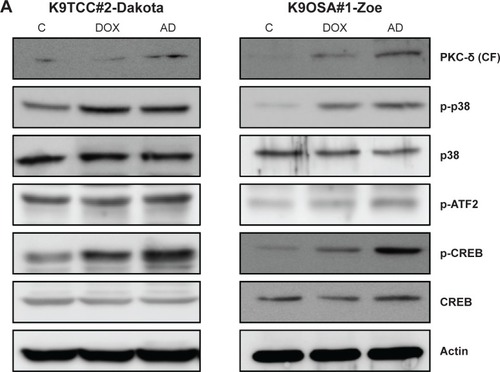
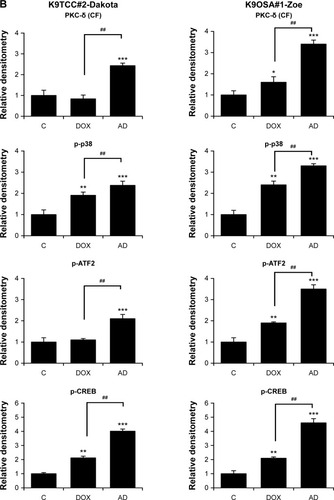
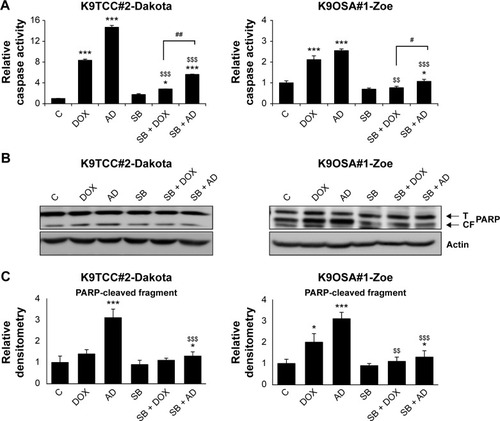
Figure 5 The inhibition of the p38 signaling pathway reduced AD198 (AD)- and DOX-induced apoptosis in tested K9TCC and K9OSA cell lines in vitro.
Notes: (A) K9TCC#2-Dakota and K9OSA#1-Zoe cells were co-treated with p38 inhibitor SB (10 μM) in combination with 1 μM DOX and 1 μM AD for 24 hours. Caspase-3/7 activities were measured using the Caspase-Glo 3/7 luminescence assay. Relative caspase activities were normalized to control. The results are representative of three replicates in two independent experiments. Values represent mean ± standard error (n=6). Paired Student’s t-tests comparing treatment to control (*P<0.05, ***P<0.001) SB untreated to SB treatments ($$P<0.01, $$$P<0.001), and SB + DOX and SB + AD treatments (#P<0.05, ##P<0.01) were used. (B) K9TCC#2-Dakota and K9OSA#1-Zoe cells were co-treated with p38 inhibitor SB (10 μM) in combination with 1 μM DOX and 1 μM AD for 24 hours. The expressions of PARP (cleaved fragment) were evaluated by WB analysis. Actin was used as loading control. The results are representative of two independent experiments. (C) Densitometry evaluation of PARP protein bands from WB analysis was done using ImageJ software. Values represent the mean of measured densitometry of each protein’s band from three replicates from two independent experiments ± standard error (n=6). Paired Student’s t-tests were used to compare treatment to control groups (*P<0.05, ***P<0.001) and SB untreated to SB treatments groups ($$P<0.01, $$$P<0.001). (D) K9TCC#2-Dakota and K9OSA#1-Zoe cells were co-treated with p38 inhibitor SB (10 μM) in combination with 1 μM DOX and 1 μM AD for 24 hours. The expressions of p-ATF2 and p-CREB were evaluated by WB analysis. Actin was used as loading control. The results are representative of two independent experiments. (E) Densitometry evaluation of p-ATF2 and p-CREB protein bands from WB analysis was done using ImageJ software. Values represent the mean of measured densitometry of each protein’s band from three replicates from two independent experiments ± standard error (n=6). Paired Student’s t-tests comparing treatment to control (*P<0.05, **P<0.01, ***P<0.001), SB untreated to SB treatments ($P<0.05, $$P<0.01, $$$P<0.001), and SB + DOX and SB + AD treatments (#P<0.05, ##P<0.01) were used.
Abbreviations: AD, AD198; ATF2, activating transcription factor 2; PARP(CF), PARP cleaved fragment; CREB, cyclic AMP response element binding protein; DOX, doxorubicin; K9OSA, canine osteosarcoma; K9TCC, canine transitional cell carcinoma; PARP, poly (ADP-ribose) polymerase; SB, SB203580; PARP(T), total PARP; WB, western blot.
Abbreviations: AD, AD198; ATF2, activating transcription factor 2; PARP(CF), PARP cleaved fragment; CREB, cyclic AMP response element binding protein; DOX, doxorubicin; K9OSA, canine osteosarcoma; K9TCC, canine transitional cell carcinoma; PARP, poly (ADP-ribose) polymerase; SB, SB203580; PARP(T), total PARP; WB, western blot.