Figures & data
Table 1 Real-time RT-PCR oligonucleotide primers
Figure 1 Optical micrographs and SEM micrographs of alginate–chitosan microspheres: (A) freeze-dried microsphere; (B) microsphere loaded with alkaloids; (C) particle size distribution of alkaloid-loaded microspheres.
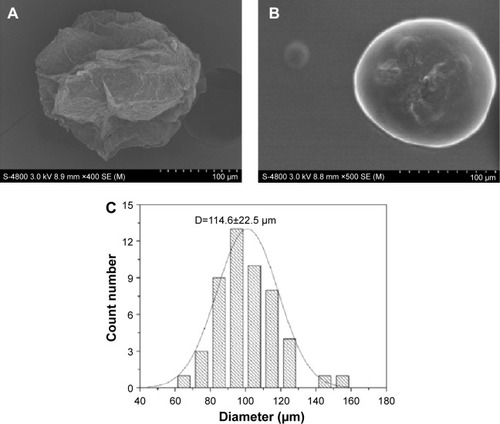
Figure 2 DSC thermograms of (a) sodium alginate, (b) chitosan, (c) physical mixture of chitosan and sodium alginate, and (d) alkaloid-loaded microspheres.
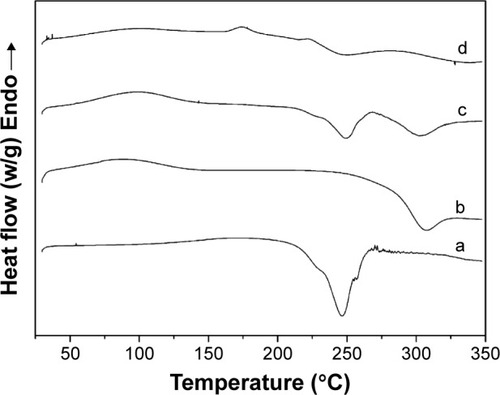
Figure 3 FTIR spectra of (a) sodium alginate, (b) chitosan, (c) physical mixture of chitosan and sodium alginate, and (d) alkaloid-loaded microspheres.
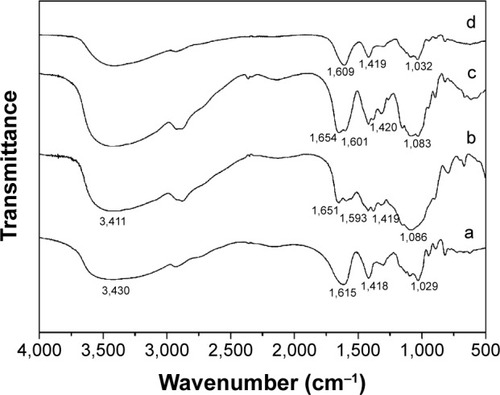
Table 2 The contents of seven alkaloids in microspheres (n=3)
Figure 4 Release curves of seven alkaloids from alginate–chitosan microspheres loaded with total alkaloids extracted from Coptis chinensis and Evodia rutaecarpa.
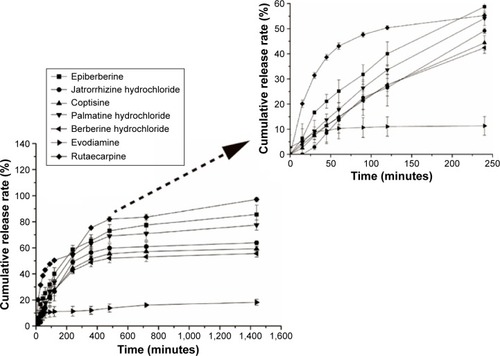
Figure 5 Mucoadhesive properties (A) in vitro and (B) in vivo.
Abbreviation: FITC, fluorescein isothiocyanate.
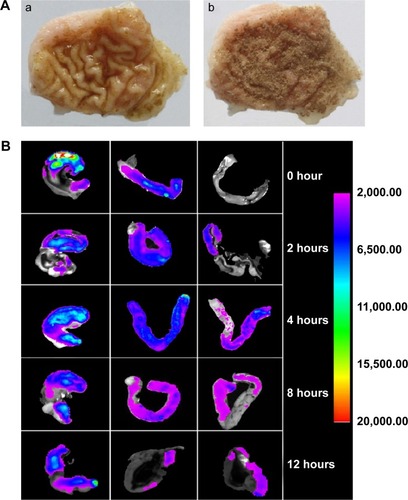
Table 3 Macroscopic analysis results of mucosa lesions induced by ethanol
Figure 6 Effects of alkaloid-loaded microspheres on (A) gross appearance and (B) H&E-stained micrographs of stomach.
Abbreviation: H&E, hematoxylin and eosin.
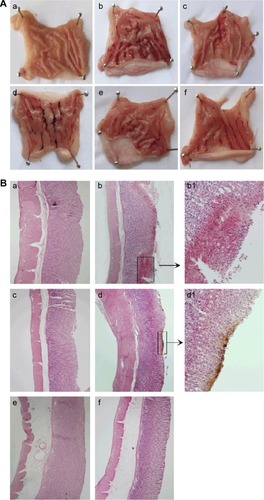
Figure 7 Effects of alkaloid-loaded microspheres on production of PGE2, TNF-α, and IL-1β in ethanol-induced gastric mucosa lesions.
Abbreviations: PEG2, Prostaglandin E2; OME, omeprazole; TNF-α, tumor necrosis factor-α; IL-1β, interleukin 1β; ELISA, enzyme-linked immunosorbent assay; SE, standard error.
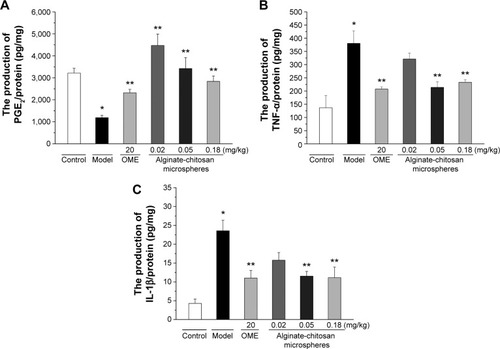
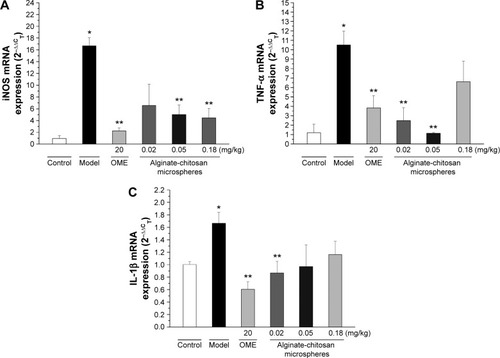
Figure 8 Effects of alkaloid-loaded microspheres on mRNA expression of iNOS, TNF-α, and IL-1β in ethanol-induced gastric mucosa lesions.
Abbreviations: OME, omeprazole; TNF-α, tumor necrosis factor-α; IL-1β, interleukin 1β; ELISA, enzyme-linked immunosorbent assay; SE, standard error; iNOS, inducible nitric oxide synthase; RT-PCR, reverse transcription polymerase chain reaction.