Figures & data
Table 1 SAQ-DK respondent characteristics according to demography among health care staff of the National Hospitals of the Faroe Islands (N=367)
Table 2 Dimensional patient safety culture results showing proportions of missing answers, proportions of staff with positive attitudes, mean scale statistics (N=367 responders), and variability across units in SAQ-DK dimensional scores (N=28 units)
Table 3 Dimensional SAQ-DK result showing the proportions of staff with positive attitudes (%-positive) and means for each of the five specialized centers; and comparison of the scores across the centers for all eight dimensions
Figure 1 Distribution of proportions of clinical leaders and frontline staff with positive attitudes toward dimensional patient safety culture.
Abbreviation: %-positive, proportion of staff with a positive attitude.
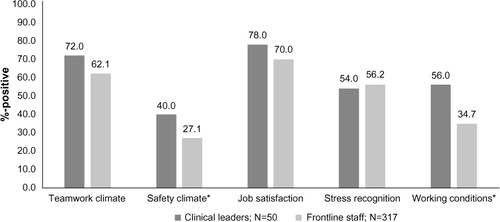
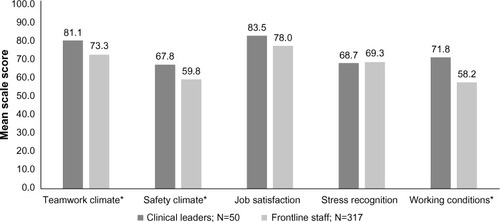
Figure 2 The degree to which (mean scale score) the clinical leaders and the frontline staff perceived dimensional patient safety culture positive.
Abbreviation: %-positive, proportion of staff with a positive attitude.