Figures & data
Table 1 Observed suicide rates by age, race, and gender for each year (1999–2006). The rates shown in this table were calculated using the number of suicide deaths and the population by group, both of which were obtained from the National Center for Health Statistics, for the period January 1, 1999 to December 31, 2006
Table 2 Observed rate of prescriptions dispensed for leukotriene-modifying agents by year. The rates shown were calculated using the number of prescriptions dispensed for each leukotriene-modifying agent, which was obtained from the Xponent™ database, IMS Health Incorporated (all rights reserved), January 1, 1999 to December 31, 2006; and along with the population data which were obtained from the National Center for Health Statistics, for the same period
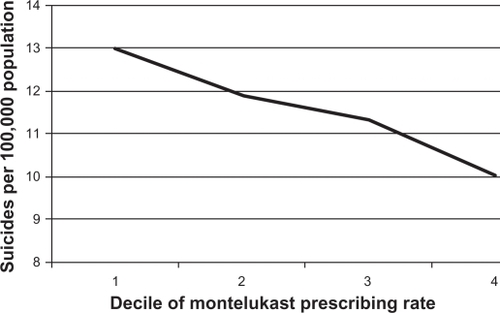
Figure 1 Relationship between county-level montelukast prescribing rate per 1000 population and county-level suicide rate per 100,000 population, 1999–2006. The horizontal axis is montelukast prescriptions dispensed per 1000 population in quartiles, while the corresponding mean suicide rate per 100,000 is shown on the vertical axis. For example, the mean suicide rate for counties in the lowest quartile of montelukast prescriptions dispensed per 1000 population was 12.97, while the mean rate was 10.02 for counties in the highest quartile. The number of suicide deaths by county and the population by county were obtained from the National Center For Health Statistics, for the period January 1, 1999 to December 31, 2006, and was used to calculate the suicide rate. The number of prescriptions for montelukast by county was obtained from the Xponent™ database, IMS Health Incorporated (all rights reserved), for the same time period, and along with the population data was used to calculate the rate of montelukast prescriptions dispensed per 1000 population.