Figures & data
Table 1 The IHI trigger tool medication module and the corresponding detectable ADEs
Figure 1 Study flow chart depicting the tool development phase.
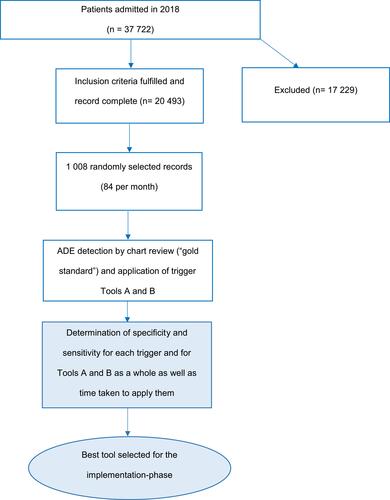
Table 2 The IHI trigger tool medication module triggers and modifications for tools A and B
Figure 2 Study flow chart depicting the tool implementation phase.
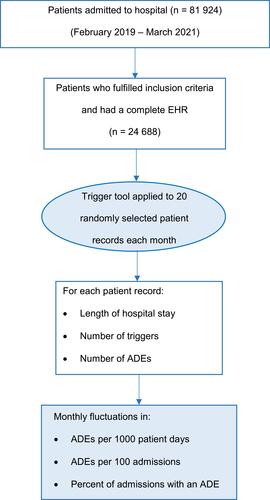
Table 3 Characteristics of included patients
Table 4 Distribution of patients according to number of ADEs they experienced and the number of triggers which were found by Tool B
Table 5 Distribution of 277 ADEs identified in 189 patients, listed according to frequency
Table 6 Frequency, positive predictive value (PPV), negative predictive value (NPV), sensitivity and specificity of the individual triggers
Table 7 Sensitivity, specificity and 95% confidence intervals (CI) of Tools A and B
Table 8 Sensitivity and specificity of the final tool according to month
Table 9 Monthly fluctuations in triggers and ADEs during the prospective 26-Month implementation phase
Figure 3 Trigger-identified adverse drug events per 1000 patient days during the 26-month prospective study period (“tool implementation phase”).
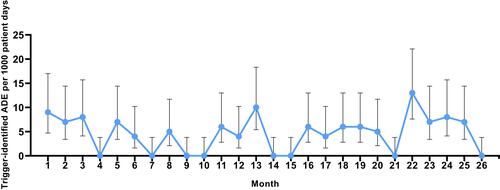
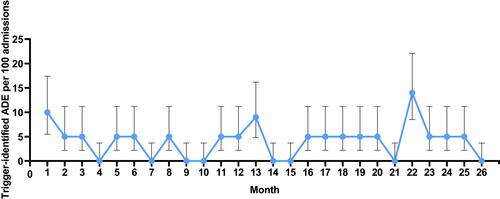
Figure 4 Trigger-identified adverse drug events per 100 admissions during the 26-month prospective study period (“tool implementation phase”).