Figures & data
Figure 1 A flow chart of the participants throughout the whole study duration.
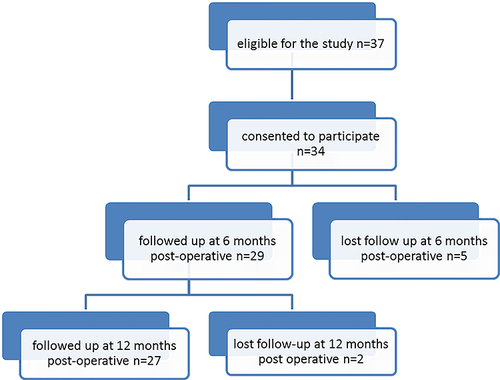
Table 1 Demographic Data of Cases of Metal on Polyethylene Hip Implant Surgery Who Completed the Follow-Up
Table 2 Comparison of Preoperative, 6 Months, and 12 Months Postoperative MMSE and MDI Categories in the Sample of 27 Co/Cr Metallic Hip Replacement Operations
Figure 2 A scatter plot diagram comparing the preoperative, 6-months postoperative, and 12-months postoperative values of serum cobalt after MOP hip implant surgery.
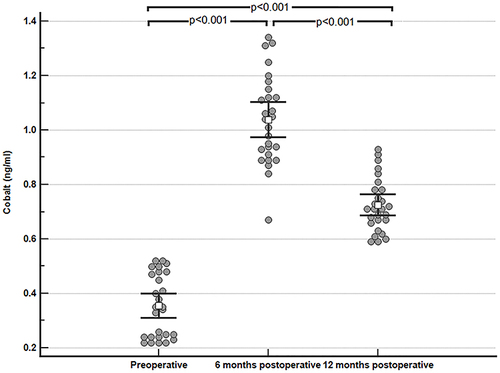
Figure 3 A scatter plot diagram comparing the preoperative, 6-months postoperative, and 12-months postoperative values of serum chromium after MOP hip implant surgery.
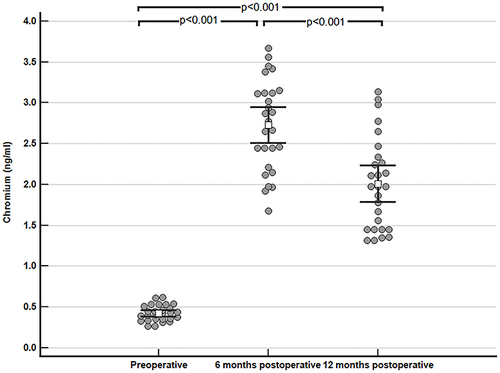
Figure 4 A scatter plot diagram comparing the preoperative, 6-months postoperative, and 12-months postoperative values of serum 8-OHdG after MOP Hip implant surgery.
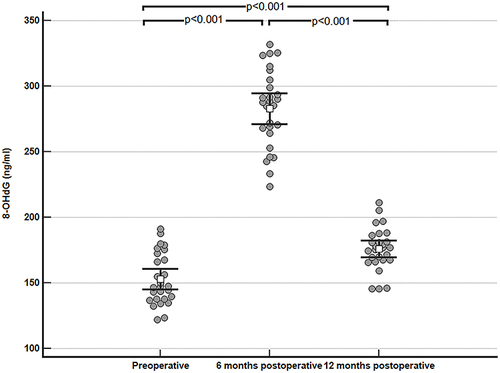
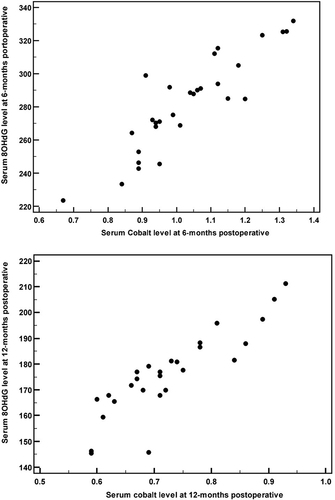
Figure 5 Pearson’s correlation between serum cobalt level (horizontal axis) and serum 8-OHdG level (vertical axis) at 6-months postoperative and at 12-months postoperative.