Figures & data
Table 1 Comparative summary description of HARMONY 7 and DURATION 6
Table 2 Baseline characteristics of patients enrolled in HARMONY 7 and DURATION 6
Table 3 Results of indirect comparison analysis using Bucher method
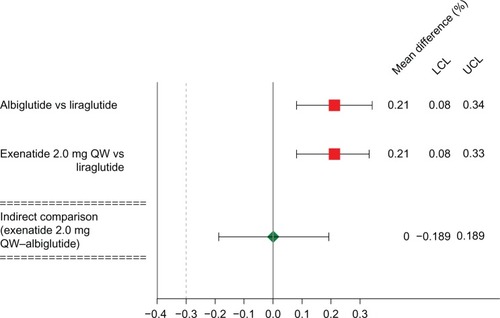
Figure 1 Forest plot of albiglutide vs exenatide 2.0 mg QW.
Abbreviations: QW, once weekly; LCL, 95% lower confidence limit; UCL, 95% upper confidence limit.