Figures & data
Table 1 Equations for sex- and race/ethnicity-specific metabolic syndrome severity Z-score
Figure 1 Correlations between MetS severity score and risk factors associated with the pathophysiology of MetS.
Notes: MetS severity scores and concurrent measures of (A) homeostasis model of insulin resistance (HOMA), (B) high-sensitivity C-reactive protein, and (C) uric acid (all assessed among participants aged 20–64 years of the National Health and Nutrition Survey 1999–2008), and (D) adiponectin (assessed among members of the Princeton Lipid Research cohort). R2 values varied by race, with HOMA 0.44 for Whites and 0.36 for Blacks and Hispanics; ln(hsCRP) 0.17 for Whites and Blacks and 0.09 for Hispanics; uric acid 0.16 for Whites, 0.06 for Blacks and 0.03 for Hispanics; and adiponectin 0.22 for Whites and Blacks combined. Reprinted from Metabolism. 63(2). Gurka MJ, Lilly CL, Norman OM, DeBoer MD. An examination of sex and racial/ethnic differences in the metabolic syndrome among adults: a confirmatory factor analysis and a resulting continuous severity score. 218–225; Copyright 2014, with permission from Elsevier,Citation61 and DeBoer MD, Gurka MJ, Morrison JA, Woo JG. Inter-relationships between the severity of metabolic syndrome, insulin and adiponectin and their relationship to future type 2 diabetes and cardiovascular disease. Int J Obes (Lond). Epub 2016 May 24,Citation71 with permission.
Abbreviations: hsCRP, high-sensitivity C-reactive protein; MetS, metabolic syndrome; HOMA, homeostatic model assessment.
Abbreviations: hsCRP, high-sensitivity C-reactive protein; MetS, metabolic syndrome; HOMA, homeostatic model assessment.
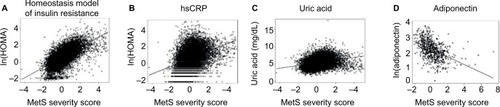
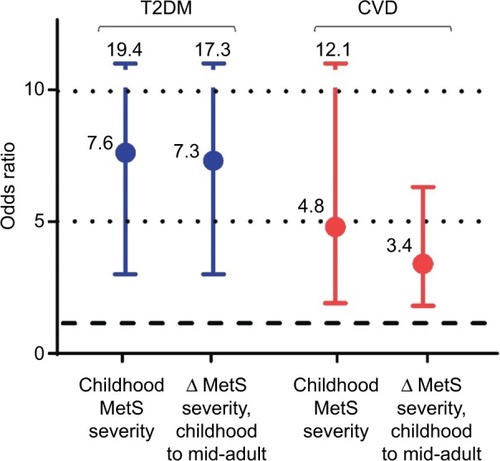
Figure 2 Odds ratios of future T2DM and CVD for every 1-point increase in MetS severity score.
Notes: Among members of the Princeton Lipid Research Clinic cohort, MetS severity scores were measured at childhood (mean age 13 years) and mid-adulthood (mean age 38 years), and adult outcomes were determined in mid-adulthood and later adulthood (mean age 50 years). Data shown are odds ratios of future disease for every 1-point (ie, 1 standard deviation score) increase in MetS severity at baseline time point and for the change in MetS severity (Δ MetS) between childhood and mid-adulthood. Data from DeBoer et al.Citation73,Citation74
Abbreviations: MetS, metabolic syndrome; CVD, cardiovascular disease; T2DM, type 2 diabetes mellitus.
Abbreviations: MetS, metabolic syndrome; CVD, cardiovascular disease; T2DM, type 2 diabetes mellitus.