Figures & data
Table 1 Sample attrition
Table 2 Baseline patient demographics
Table 3 Baseline clinical characteristics and comorbidities
Table 4 Baseline oral antihyperglycemic drugs prior to initiation of GLP-1RAsTable Footnote#
Table 5 Baseline and follow-up secondary outcomes, unadjusted results
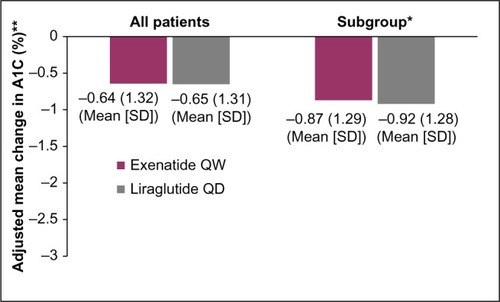
Figure 1 Adjusted models comparing the mean change in A1C from baseline to 6 months.
Notes: *Patients not at goal (A1C ≥7%) at baseline and had no pre-index insulin use; **adjusted for age, sex, race, baseline A1C, body mass index, number of other antidiabetes medication classes, Deyo–Charlson comorbidity index, insurance type, region, hyperlipidemia, and hypertension.
Abbreviations: A1C, glycated hemoglobin; QD, once daily; QW, once weekly; SD, standard deviation.
Abbreviations: A1C, glycated hemoglobin; QD, once daily; QW, once weekly; SD, standard deviation.