
Figures & data
Table 1 Baseline demographics and characteristics (full analysis set)
Figure 1 LS mean change (SE of mean) in HbA1c from baseline to the end point.
Abbreviations: LS, least-squares; SE, standard error; HbA1c, glycated hemoglobin; LM25, insulin lispro mix 25 (25% insulin lispro and 75% insulin lispro protamine suspension); G+L, glargine plus lispro.
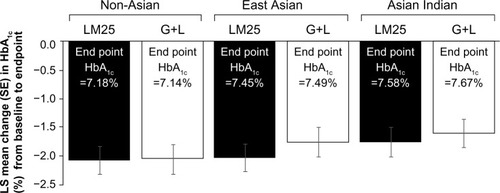
Figure 2 Percentage of patients achieving HbA1c target <7% at the end point by race/ethnicity and by treatment arm.
Abbreviations: HbA1c, glycated hemoglobin; LM25, insulin lispro mix 25 (25% insulin lispro and 75% insulin lispro protamine suspension); G+L, glargine plus lispro.
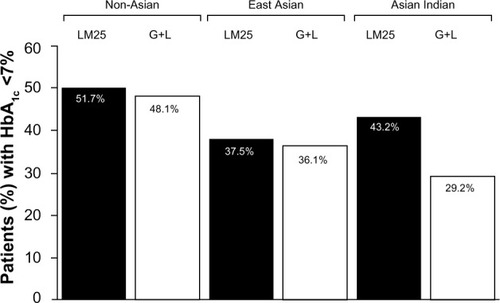
Table 2 Insulin dose/number of injections, weight change, and hypoglycemia rate
Table 3 Self-monitored blood glucose profile – actual measurements (mmol/L; excursion change from baseline)