Figures & data
Figure 1 Metabolic pathways and enzymes involved in NADH production using NAD+ as their cofactor.
Notes: The enzymes are glyceraldehyde 3-phosphate dehydrogenase in the glycolytic pathway, pyruvate dehydrogenase complex catalyzing the formation of acetyl-CoA from pyruvate, and the isocitrate dehydrogenase, α-ketoglutarate dehydrogenase, and malate dehydrogenase in the Krebs cycle. Additionally, fatty acid oxidation that yields one molecule of NADH per one molecule of acetyl-CoA produced is also shown.
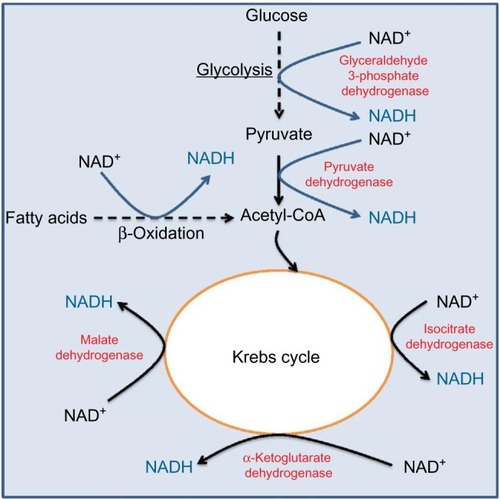
Figure 2 Polyol pathway.
Notes: Shown are the two reactions catalyzed, respectively, by aldose reductase and sorbitol dehydrogenase. The pathway makes sorbitol from glucose, fructose from sorbitol, and NADH from NADPH via NAD+. Sorbitol can trigger osmotic stress and cell death; fructose can induce nonenzymatic glycation or contributes to nonalcoholic fatty liver disease. NADH can cause reductive stress that eventually leads to oxidative stress. Additionally, NADPH depletion can also impair glutathione reductase resulting in accumulation of oxidized glutathione that can further impair cellular redox balance.
Abbreviations: GSSG, oxidized glutathione; GSH, reduced glutathione.
Abbreviations: GSSG, oxidized glutathione; GSH, reduced glutathione.
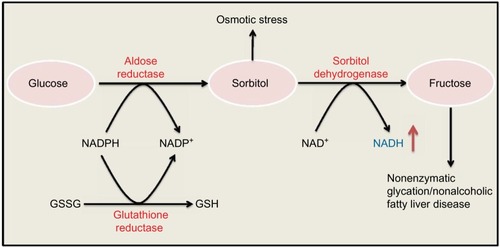
Figure 3 Two enzyme systems that are involved in NAD+ degradation.
Notes: (A) Sirtuins that catalyze protein deacetylation using NAD+ as a substrate. (B) Poly ADP ribose polymerase that catalyzes protein poly ADP ribosylation at the cost of NAD+. In both reactions, nicotinamide is formed.
Abbreviation: 2′-O-acetyl-ADPR, 2′-O-acetyl-ADP ribose.
Abbreviation: 2′-O-acetyl-ADPR, 2′-O-acetyl-ADP ribose.
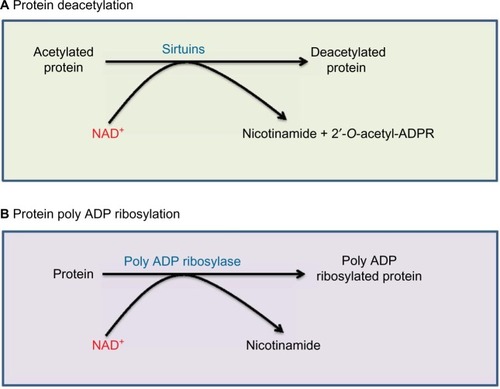
Figure 4 Major cellular enzymes involved in NAD+ regeneration.
Notes: Shown are (A) lactate dehydrogenase in red blood cells or under hypoxic conditions and (B) mitochondrial complex I that is the major site for aerobic NAD+ regeneration.
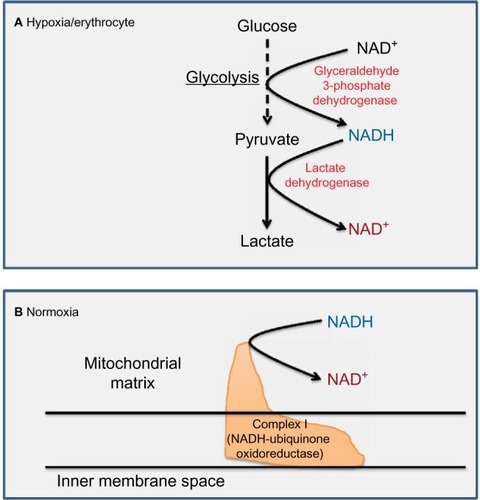
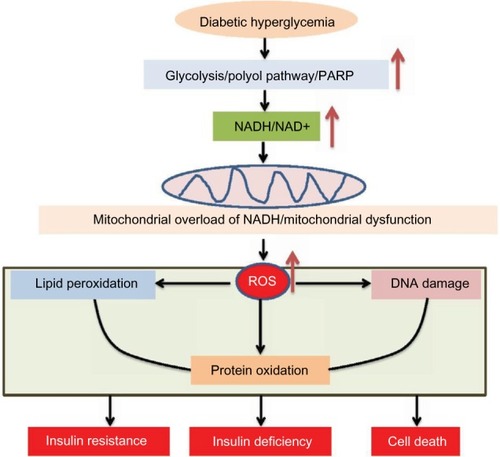
Figure 5 Consequences of NADH/NAD+ redox imbalance.
Notes: The redox imbalance can eventually elevate cellular levels of ROS that can attack proteins, DNA, and lipids. Accumulation of these damaged macromolecules can induce cell death and tissue dysfunction, which has been thought to be involved in the pathogenesis of diabetes and its complications.
Abbreviations: ROS, reactive oxygen species; PARP, poly ADP ribose polymerase.
Abbreviations: ROS, reactive oxygen species; PARP, poly ADP ribose polymerase.