Figures & data
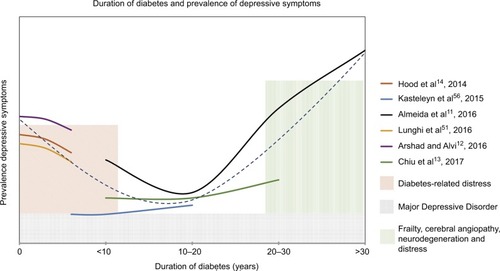
Figure 1 Venn diagram exploring intersections between symptoms of MDD (teal), diabetes-related distress (blue), fatigue (orange), and anhedonia (green).
Notes: Items are derived from the DDS-17Citation133 and Diagnostic And Statistical Manual Of Mental Disorders-5 diagnostic criteria for a depressive episode.Citation5 Both diabetes-related distress and depression can share symptoms of fatigueCitation41,Citation46,Citation47 and/or anhedonia (including anticipatory, motivational, decisional, and consummatory dimensions).
Abbreviations: DDS, Diabetes Distress Scale; MDD, major depressive disorder.
Abbreviations: DDS, Diabetes Distress Scale; MDD, major depressive disorder.
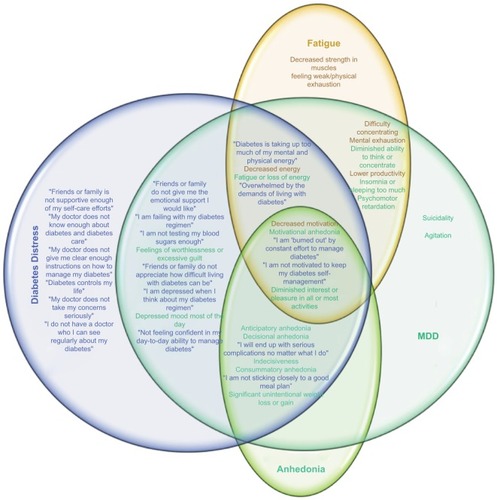
Figure 2 Temporal trend in depressive symptoms with duration of diabetes.
Notes: Results from separate studies reporting trends in depressive symptoms (colored lines) suggest a J-shaped curve (dashed line). Initial and later peaks are observed, which are thought to result from different biopsychosocial factors (colored shaded bars). The high prevalence of MDD (18%–25%) contributes to the overall prevalence of depressive symptoms, but temporal trends with duration of diabetes have not been described explicitly.
Abbreviation: MDD, major depressive disorder.
Abbreviation: MDD, major depressive disorder.