Figures & data
Figure 1 DPP-IV in vitro activity of mangiferin and standard synthetic DPP-IV inhibitor (vildagliptin and sitagliptin).
Abbreviations: DPP-IV, dipeptidyl peptidase-IV; MNG, mangiferin; VIL, vildagliptin; SIT, sitagliptin; SD, standard deviation.
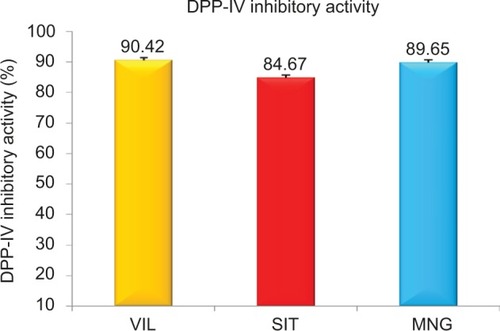
Table 1 Anthropometric and lipid profile parameters in various experimental groups
Figure 2 Percentage of change in body weight NC (n=8), HF-DC (n=7), MET (n=8), VIL (n=8), and MNG (n=7).
Abbreviations: NC, normal control; HF-DC, high-fat diabetic control; MET, metformin; VIL, vildagliptin; MNG, mangiferin.
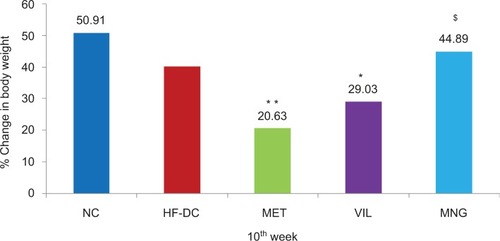
Figure 3 Time course changes in blood glucose of NC (n=8), HF-DC (n=7), MET (n=8), VIL (n=8), and MNG (n=7).
Abbreviations: NC, normal control; HF-DC, high-fat diabetic control; MET, metformin; VIL, vildagliptin; MNG, mangiferin.
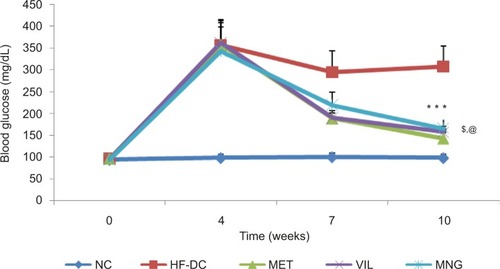
Figure 4 The HbA1c level at tenth week of NC (n=8), HF-DC (n=7), MET (n=8), VIL (n=8), and MNG (n=7).
Abbreviations: NC, normal control; HF-DC, high-fat diabetic control; MET, metformin; VIL, vildagliptin; MNG, mangiferin.
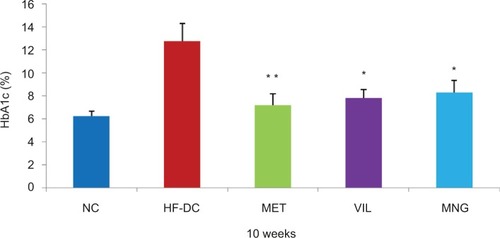
Table 2 Assessment of insulin, C-peptide, DPP-IV pathway, inflammatory, and oxidant variables in various experimental groups
Figure 5 Time course changes in CPK-MB NC (n=8), HF-DC (n=7), MET (n=8), VIL (n=8), and MNG (n=7).
Abbreviations: CPK-MB, creatine phosphokinase MB; NC, normal control; HF-DC, high-fat diabetic control; MET, metformin; VIL, vildagliptin; MNG, mangiferin.
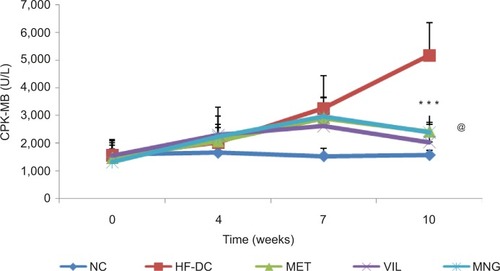
Table 3 Safety marker in various experimental groups
Figure 6 Histopathological section of myocardium.
Abbreviations: NC, normal control; HF-DC, high-fat diabetic control; MET, metformin; VIL, vildagliptin; MNG, mangiferin.
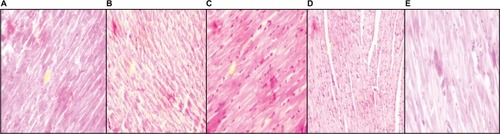
Figure 7 Histopathological section of pancreas.
Abbreviations: NC, normal control; HF-DC, high-fat diabetic control; MET, metformin; VIL, vildagliptin; MNG, mangiferin.
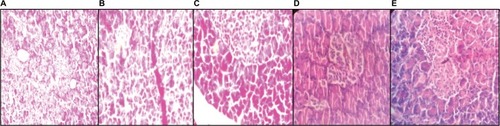
Figure 8 Histopathological section of liver.
Abbreviations: NC, normal control; HF-DC, high-fat diabetic control; MET, metformin; VIL, vildagliptin; MNG, mangiferin.
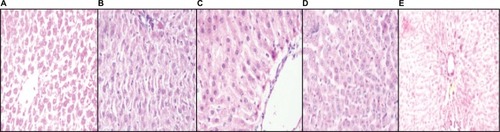
Figure 9 Histopathological section of kidney.
Abbreviations: NC, normal control; HF-DC, high-fat diabetic control; MET, metformin; VIL, vildagliptin; MNG, mangiferin.
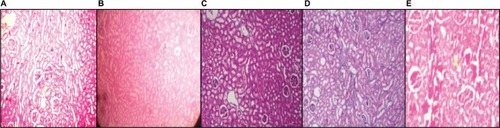
Table 4 Immnunohistochemistry (IHC) of pancreas for localization of insulin
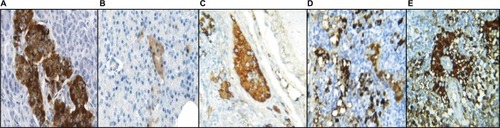
Figure 10 Immunohistochemistry of pancreas.
Abbreviations: NC, normal control; HF-DC, high-fat diabetic control; MET, metformin; VIL, vildagliptin; MNG, mangiferin.