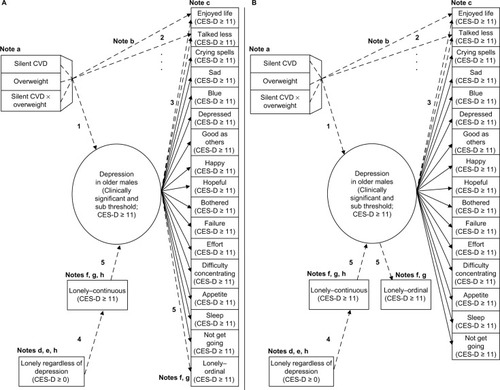
Notes: Note a: The dichotomous predictors in (
A) and (
B) represent the presence/absence of the condition. The first-order terms in the upper left portion of (
A) and (
B) are global predictors of effects involving silent CVD or overweight, while the interaction term reveals the additional effect when both conditions co-occur.
Note b: The descriptive MIMIC model in (
A) and (
B) reflects endorsement of the items enjoyed life (CES-D ≥ 11) and talked less (CES-D ≥ 11) that can be attributed to co-occurring atherosclerosis and being overweight (Path 2), after adjusting for endorsement that can be attributed instead to the overall level of the latent trait of depression in these conditions (Paths 1 and 3).
Note c: While all 20 CES-D items are specified in the actual model, (
A) and (
B) shows only 17 items. Sixteen items are traditional symptoms of depression, and the final item, lonely (CES-D ≥ 11), is one of the four non-traditional symptoms in the CES-D scale. Although direct effects from silent CVD, overweight, and their interaction are specified to all 20 CES-D items, to keep (
A) and (
B) clear and simple, they are only drawn (Path 2) to the two CES-D items for which the direct effects are statistically significant: enjoyed life (CES-D ≥ 11) and talked less (CES-D ≥ 11). Also, arrows are not drawn to reflect the residual effects from each of the 17 CES-D items to minimize distracting complexity within the figure.
Note d: Although each of the four non-traditional items (lonely, fearful, people were unfriendly, and people disliked me) contributes to the sensitivity and specificity of the CES-D scale in detecting real cases of subsequently confirmed clinical depression, they are not standard symptoms of depression. Corresponding instrumental variables (when CES-D ≥ 11) are specified to predict virtually all the variation within each of these four non-traditional items (when CES-D ≥ 0) because unpredicted residual variation within any of them may confound direct estimates (Path 2) to any of the remaining 16 standard items of depression. In addition, at least one of these instrumental variables is needed to resolve the problem of estimation indeterminacy that would otherwise result due to there being one too few degrees of freedom for estimation of a MIMIC model in which every direct effect is specified.
Note e: The last predictor shown in (
A) and (
B), lonely regardless of depression (CES-D ≥ 0), is added 1) to account for unique variation from the last CES-D item, lonely–continuous (CES-D ≥ 11; Path 4); and 2) to permit estimation of the bi-directional effects of lonely (CES-D ≥ 11) by using two versions (ie, continuous and ordinal) of the variable (bi-directional Path 5). Because the instrumental variable lonely (CES-D ≥ 11) is a subset of the broader original variable, lonely regardless of depression (CES-D ≥ 0), the former accounts for virtually all the remaining variation in lonely (CES-D ≥ 0), which prevents confounding of direct paths to other items (Path 2). Although not shown, similar instrumental variables and bi-directional effects are specified for each of the three remaining non-traditional items (fearful, people were unfriendly, and people disliked me).
Note f: In (
A) and (
B), part of the overall variation in lonely (CES-D ≥ 11), attributed to pre-existing lonely feelings, predicts the latent trait of depression. In (
A), part of the overall variation in lonely (CES-D ≥ 11) manifests as an item from the measurement model portion of the MIMIC (ie, in bi-directional Path 5, the right path is an effect indicator with factor loading parameter λ), reflecting lonely feelings that manifest as a component of the latent factor for depression. However, in (
B), this part of the overall variation in lonely (CES-D ≥ 11) occurs as a separate factor in the structural (regression) portion of the model; it is an outcome of the latent factor for depression (ie, with causal parameter B). Estimated values of the parameters for lonely,
λ and B, are equivalent. Thus, estimates from both versions of the MIMIC model are equivalent.
Note g: To prevent confounding of direct effects to the traditional symptoms of depression, the same type of specification used with the lonely item is used with each of the remaining three non-traditional CES-D depression items not shown in (
A) and (
B) (ie, fearful, people were unfriendly, and people disliked me). In the same way that lonely–continuous (CES-D ≥ 0) predicts its instrumental variable (ie, lonely–continuous [CES-D ≥ 11]), each of these three items predicts its corresponding instrumental variable when CES-D ≥ 11 (not shown). Although bi-directional arrows are only drawn (Path 5) to and from lonely (CES-D ≥ 11) in (
A) and (
B), all four items are estimated with bi-directional effects, and again, estimated values of the parameters λ and B remain equivalent.
Note h: David Kenny’s web page on identification discusses the conditions in which instrumental variables may be used.
Citation68 One important condition is that the instrumental variable must be highly correlated with the original variable, but cannot be correlated with the residual term when the original variable is regressed on the instrumental variable:
Y =
b(
I) +
U, where
Y is the original variable,
I is the instrumental variable, and
U is the residual term. In the innovative instrumental variable approach for estimating an exhaustively specified MIMIC introduced in the present study, the original variable for a particular CES-D item,
Y, includes the responses from participants with residual symptoms (CES-D < 11) as well as the responses from participants with subthreshold and clinically significant symptoms (CES-D ≥ 11). In contrast, the instrumental variable,
I, only reflects subthreshold and clinically significant symptoms (CES-D ≥ 11); the original responses for participants with subthreshold or clinically significant symptoms are retained, while the responses for participants with residual symptoms are set to zero. This means that for participants with residual symptoms,
I is always zero, while
U is identical to
Y, resulting in a low correlation between the instrumental variable (
I) and the residual term (
U). Similarly, for participants with subthreshold or clinically significant symptoms,
I is identical to
Y and
U is always zero, again resulting in a low correlation between the instrumental variable (
I) and the residual term (
U).
Abbreviations: CES-D, Center for Epidemiologic Studies Depression Scale; CVD, cerebrovascular disease.