
Figures & data
Figure 1 Flow chart of participant recruitment.
Abbreviation: BMI, body mass index.
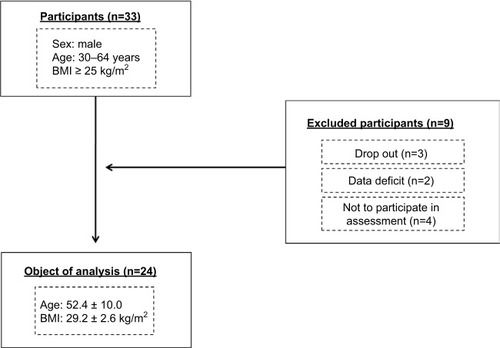
Table 1 Total energy intake before and after a 12-week dietary restriction program
Table 2 Characteristics of participants before and after a 12-week dietary modification program
Table 3 Partial correlation coefficients adjusted for ageTable Footnotea
Table 4 Correlations between the rates of change in lower extremity muscle mass and body weight and lower extremity muscle strength adjusted for age