
Figures & data
Figure 1 Consort flowchart showing the design of the study.
Abbreviations: IHM, Individual Health Management; UC, usual care.
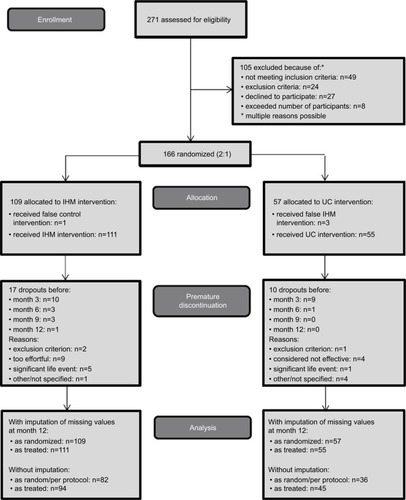
Figure 2 Schematic course of IHM in weight reduction with study examination visits embedded. Visits embedded (white bars). Introduction days (gray lined bars), 10 × 2-hour after-work sessions (gray bars) including self-monitoring ![]()
Abbreviation: IHM, Individual Health Management.
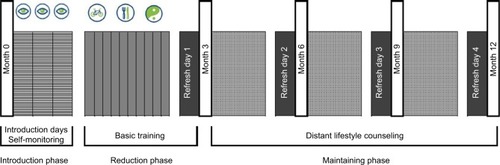
Table 1 Basic sample description and baseline values for secondary outcome parameters
Figure 3 Mean weight in both treatment groups during the course of the study, separated by gender.
Notes: Thick black lines represent whole-group totals; per protocol subjects only.
Abbreviations: IHM, Individual Health Management; UC, usual care.
Abbreviations: IHM, Individual Health Management; UC, usual care.
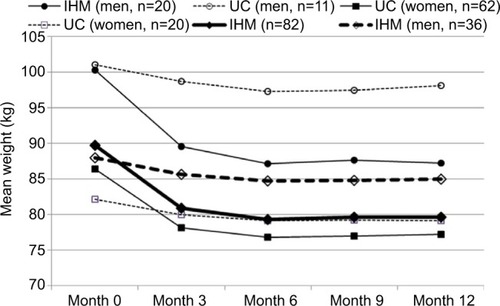
Figure 4 Scatterplot for weight measurements at months 0 and 12 (without imputations).
Notes: Solid line shows diagonal of equal values at both examinations; dashed line represents a 7.5% reduction at month 12.
Abbreviations: IHM, Individual Health Management; UC, usual care.
Abbreviations: IHM, Individual Health Management; UC, usual care.
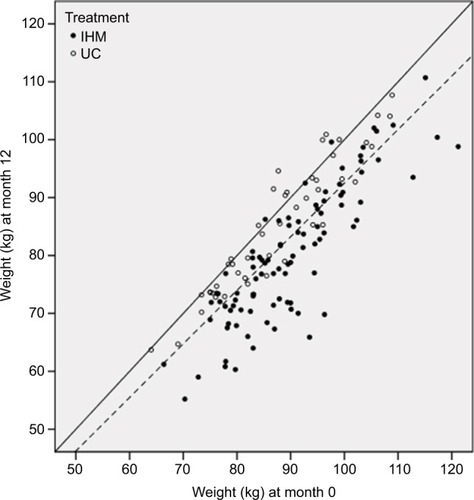
Table 2 Secondary outcome parameter: change from baseline to month 12