Figures & data
Table 1 Characteristics of the study population
Figure 1 Mean GADA titers across quartiles of IR indices (HOMA-IR [A] and incremental area under the insulin curve [B]) and insulin secretion indices (corrected insulin response [C] and HOMA-beta cell% [D]). Error bars represent standard deviations.
Abbreviations: GADA, glutamic acid decarboxylase antibody; HOMA-IR, homeostasis model assessment-insulin resistance.
![Figure 1 Mean GADA titers across quartiles of IR indices (HOMA-IR [A] and incremental area under the insulin curve [B]) and insulin secretion indices (corrected insulin response [C] and HOMA-beta cell% [D]). Error bars represent standard deviations.](/cms/asset/7f0bbcd1-1a74-49ca-b16b-66aee4e17565/dmso_a_137216_f0001_b.jpg)
Figure 2 Mean GADA titers across quartiles of HbA1c.
Notes: Error bars represent standard deviations. p-value from analysis of variance: 0.25.
Abbreviations: GADA, glutamic acid decarboxylase antibody; HbA1c, hemoglobin A1c.
Abbreviations: GADA, glutamic acid decarboxylase antibody; HbA1c, hemoglobin A1c.
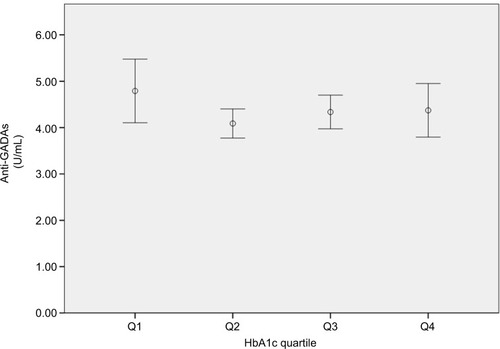
Figure 3 Mean GADA titers across categories of body mass index.
Note:p-value from analysis of variance: 0.46.
Abbreviation: GADA, glutamic acid decarboxylase antibody.
Abbreviation: GADA, glutamic acid decarboxylase antibody.
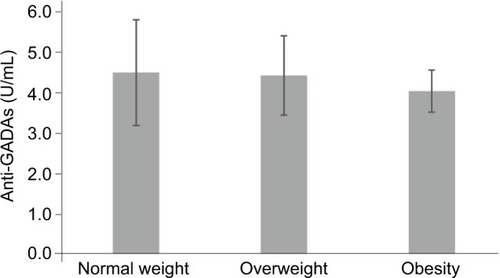
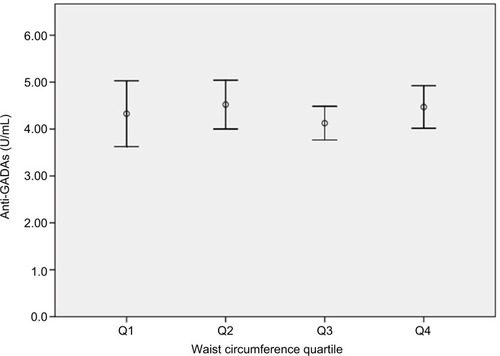
Figure 4 Mean GADA titers across quartiles of waist circumference.
Note:p-value from analysis of variance: 0.46.
Abbreviation: GADA, glutamic acid decarboxylase antibody.
Abbreviation: GADA, glutamic acid decarboxylase antibody.