Figures & data
Table 1 Characteristics of the studies included in the systematic review
Table 2 Summary of outcomes reported in the studies included in the meta-analysis
Figure 1 Flow of study selection.
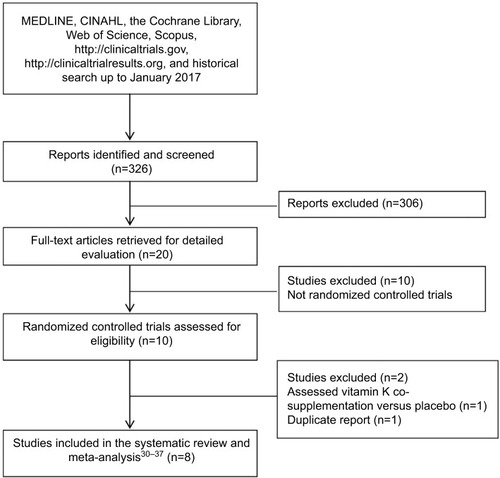
Figure 2 Mean difference (95% CI) in HOMA-IR, FPG, FPI, leptin, IL-6, and CRP.
Abbreviations: CI, confidence interval; CRP, C-reactive protein; FPG; fasting plasma glucose; FPI, fasting plasma insulin; HOMA-IR, homeostasis model of insulin resistance; IL-6, interleukin-6.
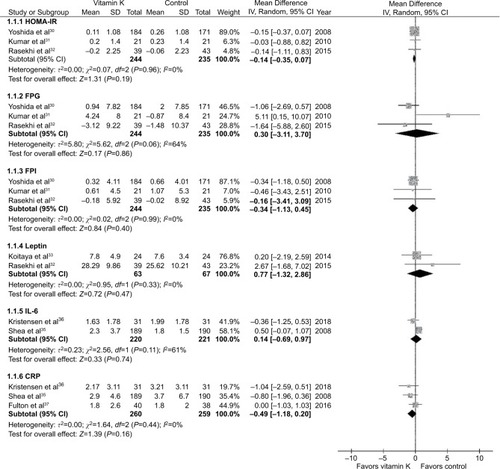
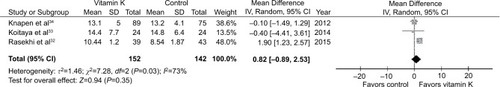
Figure 3 Mean difference (95% CI) in adiponectin.
Abbreviation: CI, confidence interval.