
Figures & data
Figure 1 Flowchart of study participants.
Abbreviations: BMI, body mass index; ITT, intention to treat; PPB, per protocol based.
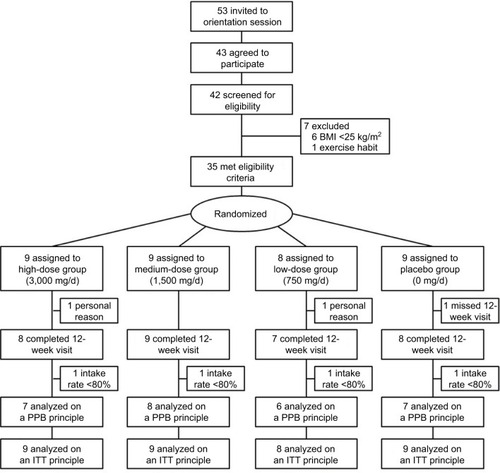
Table 1 Baseline participant characteristics
Table 2 Intention-to-treat analyses for primary, secondary, and compliance outcomes (n=35)
Table S1 Per-protocol-based analyses for primary, secondary, and compliance outcomes (n=28)
Table S2 Adverse events identified by participant’s diary logs (n=35)
Table S3 Adverse events identified during the study period by blood pressure recordings and fasting blood test (n=35)