
Figures & data
Table 1 Patients’ demographics and baseline comorbidities
Table 2 Prevalence of metabolic syndrome and its components before (“pre”) and 4 years following (“post”) RYGB and SG for the entire cohort
Table 3 Predictors of metabolic syndrome presence at 4-year follow-up using the entire cohort
Figure 1 Weight (kg), body mass index (kg/m2), percent weight change (%), and excess weight loss (%) per procedure type for the entire cohort.
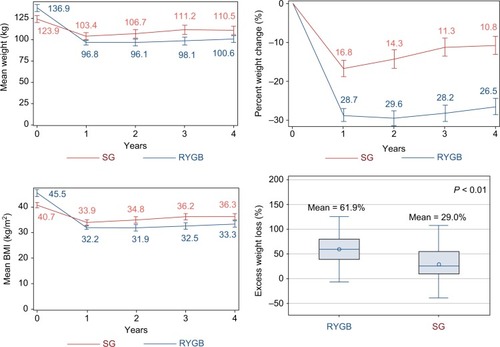
Figure 2 Weight (kg), body mass index (kg/m2), percent weight change (%), and excess weight loss (%) per procedure type for the matched cohort.
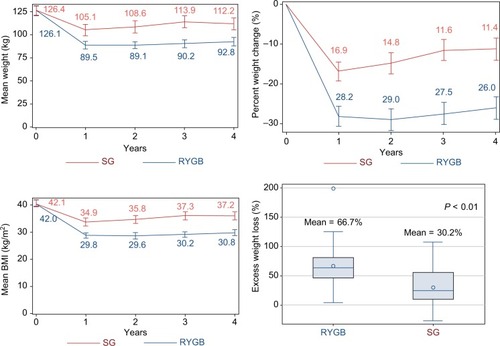
Table 4 >30 day-morbidity and mortality following RYGB and SG
Figure S1 Flowchart of cohort sample size for analyses.
Table S1 Prevalence of metabolic syndrome and its components before (“Pre”) and 4 years following (“Post”) RYGB and SG for the matched cohort