
Figures & data
Table 1 Characteristics of studies of lower extremity DNS for diabetic peripheral neuropathy
Table 2 Assessment of bias scored as high, unclear, or low risk of bias
Figure 1 Flow diagram of literature search results.
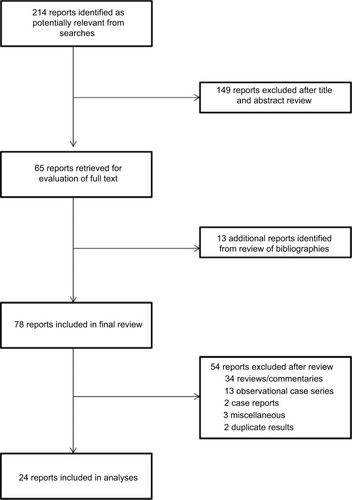
Table 3 Global subjective pain scores pre- and post-DNS; mean ± SD and estimated effect size (median value and range), where a positive effect size value indicates improvement
Table 4 2PD pre- and post-DNS; mean ± SD and effect size (median value and range), where positive effect size value indicates improvement
Table 5 Nerve conduction study results pre- and post-DNS; mean ± SD and effect size (median value and range), where positive effect size value indicates improvement