Figures & data
Figure 1 Structure of insulin lispro, showing the amino acid modifications that produce insulin lispro.
Modified from PDB ID: 3E7Y Timofeev VI, Baidus AN, Kislitsyn YA, Juranova IP.
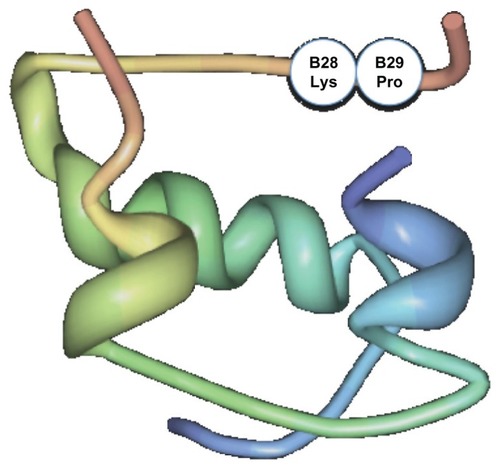
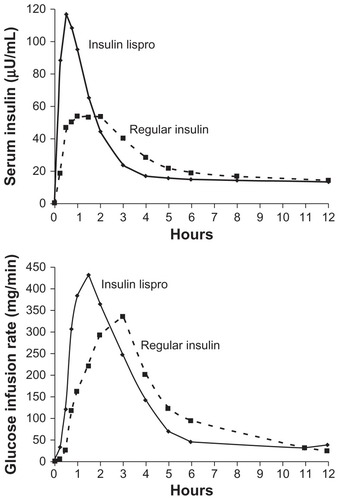
Figure 2 (A) Concentration of insulin lispro reaches its peak in half of the time that human regular insulin takes to reach its peak. (B) The highest glucose infusion rate is reached in half of the time for insulin lispro compared with human regular insulin.
Reprinted with permission from Holleman MD, Hoekstrra JBL. Insulin Lispro. N Engl J Med. 1997;337:176–183.Citation67