Figures & data
Table 1 Anthropometric data among study female groups
Table 2 Blood glucose and lipid profile among study groups
Figure 1 Glucose and lipid profile in controls and cases of MS.
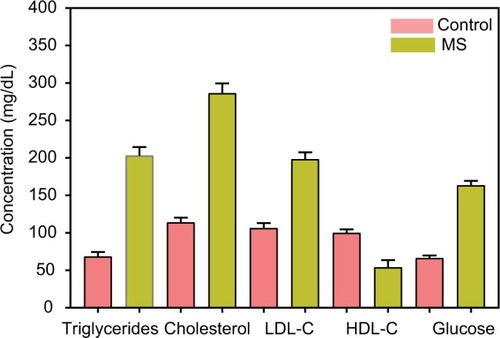
Figure 2 Correlation between glucose (A), triglycerides (B), cholesterol (C), LDL-C (D), and BMI among the whole study group.
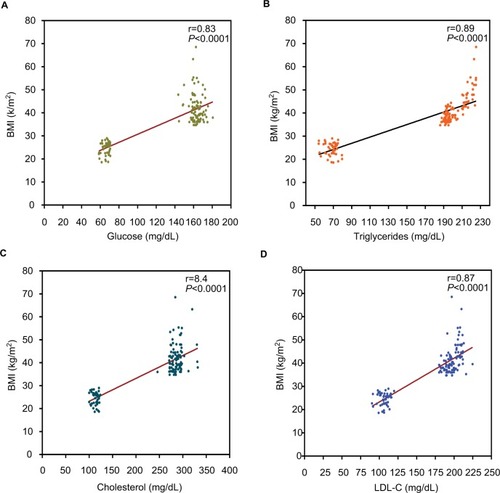
Figure 3 Correlation between HDL-C and BMI among the whole study group.
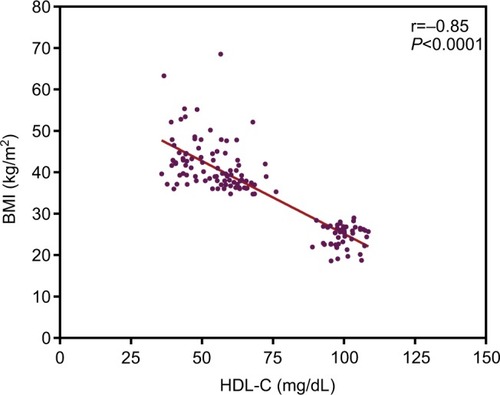
Figure 4 Correlation between glucose, cholesterol, triglycerides, LDL-C, and waist circumference among the whole study group. (A) Fasting blood sugar levels and BMI; (B) triglycerides and BMI; (C) cholesterol and BMI; (D) LDL-C and BMI.
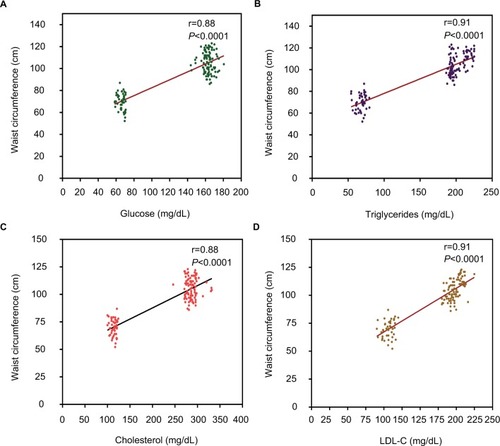
Figure 5 Correlation between HDL-C and waist circumference among the whole study group.
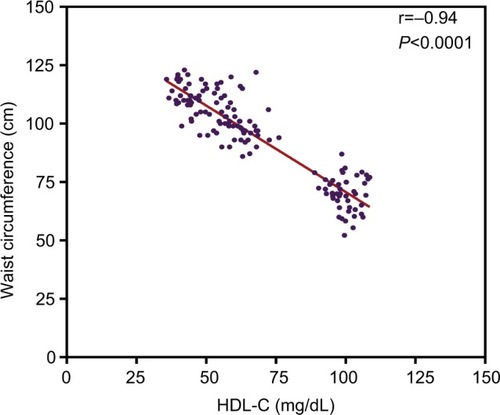
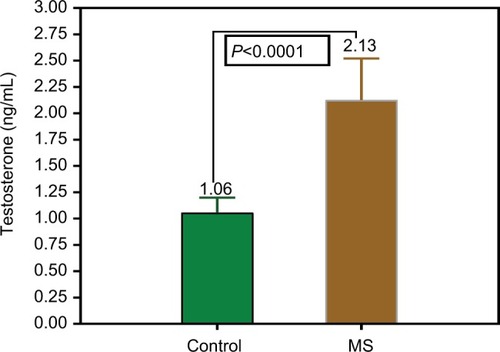
Figure 6 The levels of testosterone in controls and women with MS.