
Figures & data
Table 1 Unit costs in the base-case analysis
Table 2 Cost-effectiveness of insulin detemir versus NPH insulin in the UK
Figure 1 Cost-effectiveness scatter plot for insulin detemir relative to NPH insulin in patients with type 1 diabetes.
Abbreviations: NPH, neutral protamine Hagedorn; QALY, quality-adjusted life year; GBP, 2016 pounds sterling.
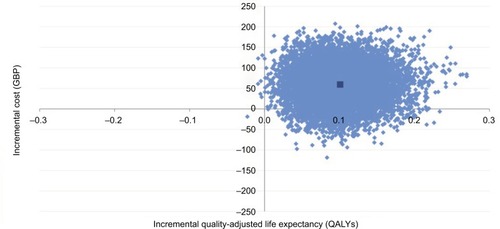
Figure 2 Cost-effectiveness acceptability curve for insulin detemir relative to NPH insulin in patients with type 1 diabetes.
Abbreviations: NPH, neutral protamine Hagedorn; QALY, quality-adjusted life year; GBP, 2016 pounds sterling.
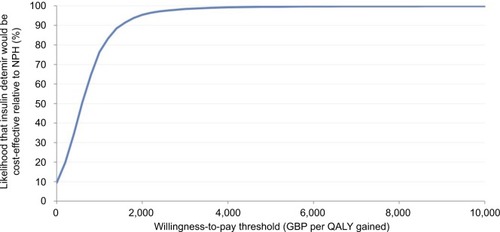
Figure 3 Cost-effectiveness scatter plot for insulin detemir relative to NPH insulin in patients with type 2 diabetes.
Abbreviations: NPH, neutral protamine Hagedorn; QALY, quality-adjusted life year; GBP, 2016 pounds sterling.
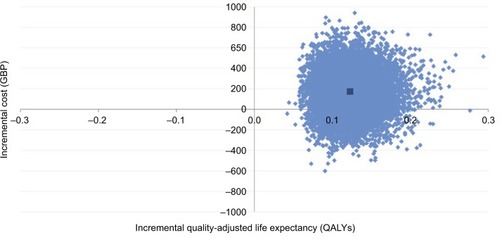
Figure 4 Cost-effectiveness acceptability curve for insulin detemir relative to NPH insulin in patients with type 2 diabetes.
Abbreviations: NPH, neutral protamine Hagedorn; QALY, quality-adjusted life year; GBP, 2016 pounds sterling.
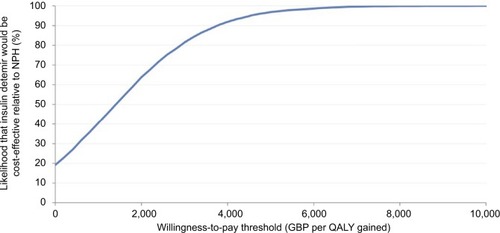
Table 3 One-way sensitivity analysis results