Figures & data
Table 1 Kidney weight, kidney index, heart weight, heart index, blood glucose, water intake, food intake, urine output and 24 h urinary albumin excretion in sham and HD groups on experimental day P27
Figure 1 Alloxan produced the development of HD in female rats (sham n=8, HD n=7).
Abbreviations: HD, hidden diabetes; FBG, fasting blood glucose; OGTT, oral glucose tolerance test; AUC, area under the curve; P0, prealloxan treatment day; P1, posttreatment day 1; P7, posttreatment day 7; P27, posttreatment day 27.
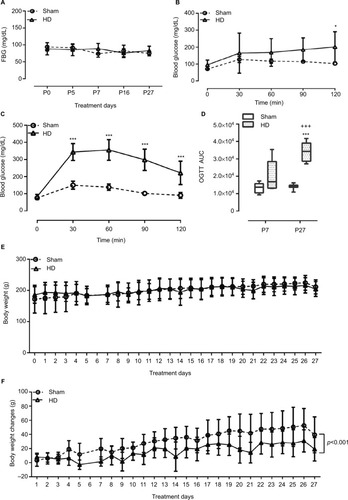
Table 2 Leukogram of sham and HD groups on experimental days P7 and P27
Figure 2 Leukogram of female rats with or without alloxan treatment on P7 (n=5 and n=6, respectively) and P27 (n=7 and n=8, respectively).
Abbreviations: P7, posttreatment day 7; P27, posttreatment day 27; NLR, neutrophil–lymphocyte ratio; HD, hidden diabetes; DM, diabetes mellitus.
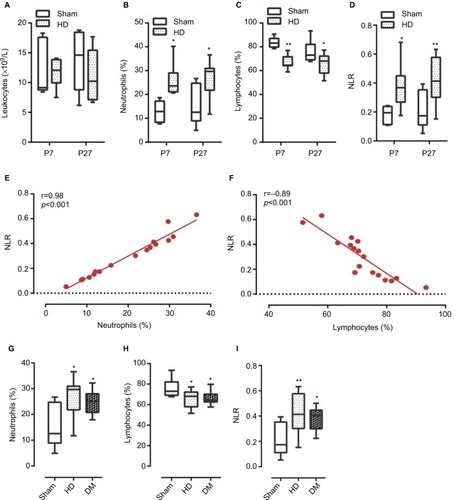
Figure 3 Leukogram of female rats with or without OG and OG+GSH treatments on P7 (n=7 for all groups).
Abbreviations: OG, oscillating glucose; GSH, glutathione; P7, posttreatment day 7; PC, precontrol; P1h, 1 h post-glucose; NLR, neutrophil–lymphocyte ratio.
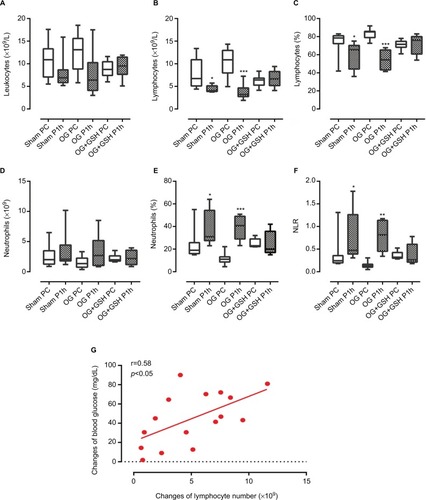
Figure 4 Development of pancreatic and renal pathology of HD with diabetes mellitus on days P7 and P27 after alloxan treatment.
Abbreviations: HD, hidden diabetes; P7, posttreatment day 7; P27, posttreatment day 27.
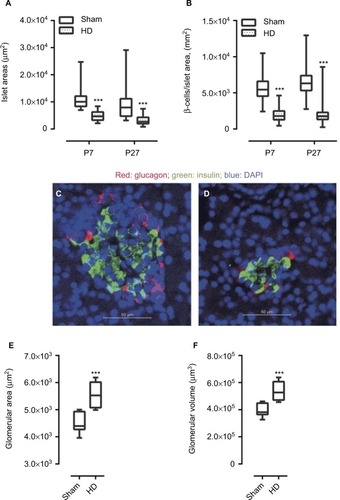
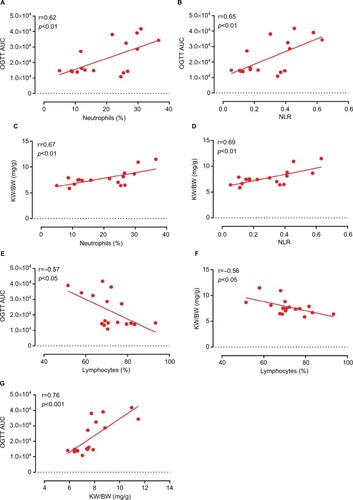
Figure 5 Relationships among leukogram data, glucose metabolic changes, and kidney index values after 27 days of alloxan treatment.
Abbreviations: OGTT, oral glucose tolerance test; AUC, area under the curve; NLR, neutrophil–lymphocyte ratio; KW/BW, kidney weight/body weight ratio.