
Figures & data
Table 1 Age and sex distribution of POAG
Figure 1 POAG patients with hypertension and diabetes.
Abbreviation: POAG, primary open-angle glaucoma.
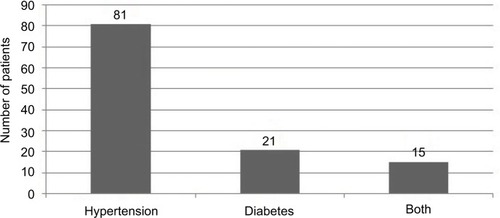
Table 2 Ocular findings of patients of POAG with and without HTN
Table 3 Severity of VFD in relation to HTN
Table 4 Ocular findings of patients of POAG with and without DM
Table 5 Severity of VFD in relation to diabetes
Table 6 Ocular findings of patients of POAG with HTN and DM and without HTN and DM
Table 7 Severity of VFD in relation to DM and HTN