
Figures & data
Figure 1 Diagram of the study design used for research of proteomic biomarker in the serum of individuals.
Abbreviations: LC–MSE, liquid chromatography––data-independent label-free mass spectrometry; IgG, immunoglobulin G.
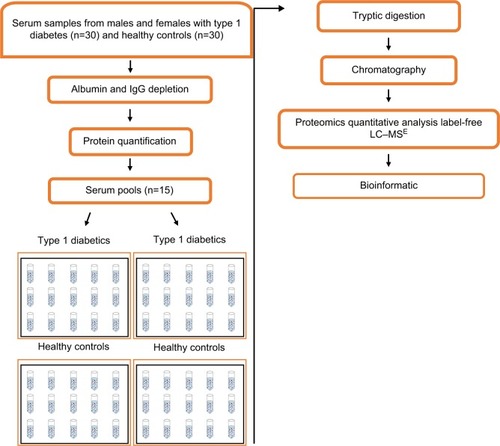
Table 1 Demographic, anthropometric, and clinical characteristics of participants in study
Table 2 Characterization of differentially expressed proteins in serum of DM1 patients compared with HCs as identified by LC–MSE
Figure 2 Percentage of serum proteins identified from albumin and immunoglobulin G depleted serum by LC–MSE for patients with type 1 diabetes and healthy controls based on their molecular function, biological process, and cellular components.
Abbreviations: ER, endoplasmic reticulum; LC–MSE, liquid chromatography––data-independent label-free mass spectrometry.
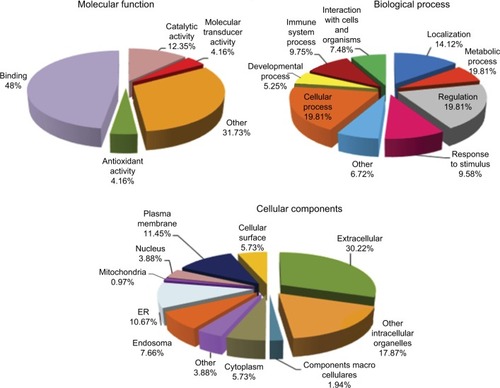
Table S1 List of serum proteins between type 1 diabetes patients and healthy controls as identified by LC–MSE analysis