Figures & data
Table 1 Clinical characteristics of the subjects
Table 2 Effect of plasma zonulin concentrations on the risk of fatty liver disease
Table 3 Median concentration of plasma zonulin according to fatty liver severity in the subgroups
Figure 1 OR of zonulin concentration in fatty liver disease in the appropriate drinking subgroup.
Notes: In the multivariate multinomial logistic regression analysis adjusted for covariates, the OR of zonulin concentrations in relation to the incidence of mild fatty liver was 1.63 (adjusted OR=1.63, 95% CI=0.75–3.55) in the appropriate drinking group and was not statistically significant. However, the OR for moderate-to-severe fatty liver was 1.91 (95% CI=1.01–3.95) in the same group and was statistically significant.
Abbreviations: OR, odds ratio; CI, confidence interval.
Abbreviations: OR, odds ratio; CI, confidence interval.
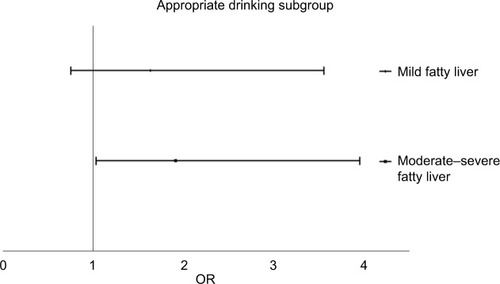
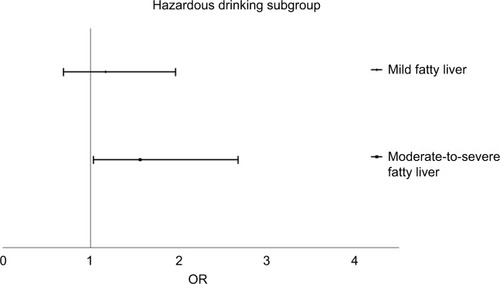
Figure 2 OR of zonulin concentration in fatty liver disease in the hazardous drinking subgroup.
Notes: In the multivariate multinomial logistic regression analysis adjusted for covariates, the OR of zonulin concentrations in relation to the incidence of mild fatty liver was 1.17 (95% CI=0.69–1.96) in the hazardous drinking group and was not statistically significant. However, the OR for moderate-to-severe fatty liver was 1.56 (95% CI=1.02–2.67) in the same group and was statistically significant.
Abbreviation: OR, odds ratio.
Abbreviation: OR, odds ratio.