
Figures & data
Figure 1 The prescription of the “1,2,3 diet” handed to the patient.
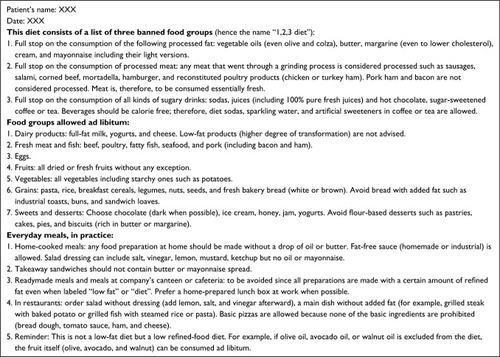
Figure 2 Patient inclusion flowchart.
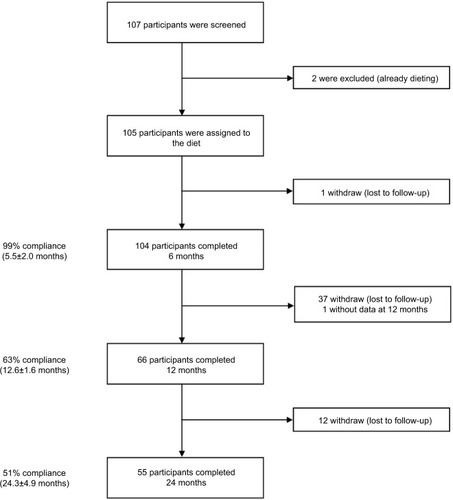
Table 1 Baseline characteristics of the study participantsTable Footnotea
Figure 3 Weight changes over 2 years.
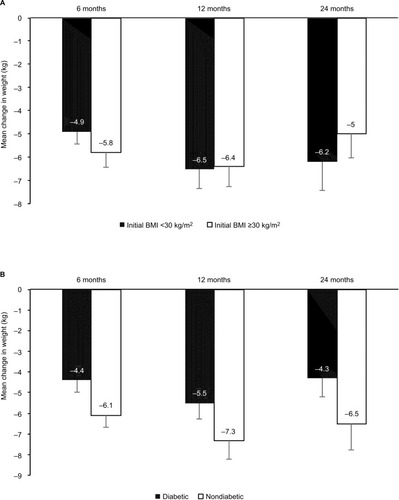
Figure 4 Weight changes according to initial BMI (A) and type 2 diabetes mellitus (B) at various time points.
Notes: T bars indicate standard errors. In the subgroup of initial BMI <30 kg/m2, the number of participants was 49 at 6 months, 27 at 12 months, and 20 at 24 months. It was, respectively, 55, 39, and 34 in the subgroup of initial BMI ≥30 kg/m2. In the subgroup of diabetic participants, the number of participants was 42 at 6 months, 31 at 12 months, and 26 at 24 months. It was, respectively, 62, 35, and 28 in the subgroup of nondiabetic participants.
Abbreviation: BMI, body mass index.
Abbreviation: BMI, body mass index.
Note: Vertical bars indicate standard errors.
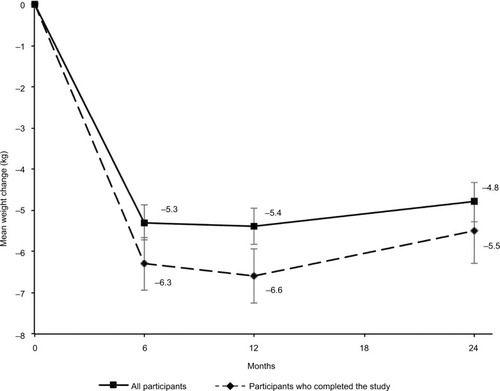
Figure 4 Weight changes according to initial BMI (A) and type 2 diabetes mellitus (B) at various time points.
Notes: T bars indicate standard errors. In the subgroup of initial BMI <30 kg/m2, the number of participants was 49 at 6 months, 27 at 12 months, and 20 at 24 months. It was, respectively, 55, 39, and 34 in the subgroup of initial BMI ≥30 kg/m2. In the subgroup of diabetic participants, the number of participants was 42 at 6 months, 31 at 12 months, and 26 at 24 months. It was, respectively, 62, 35, and 28 in the subgroup of nondiabetic participants.
Abbreviation: BMI, body mass index.
Abbreviation: BMI, body mass index.
Figure 5 HbA1c at various time points.
Notes: Vertical bars indicate standard errors. Number of participants was 42 at baseline, 42 at 6 months, 31 at 12 months, and 26 at 24 months.
Abbreviations: HbA1c, glycated hemoglobin.
Abbreviations: HbA1c, glycated hemoglobin.
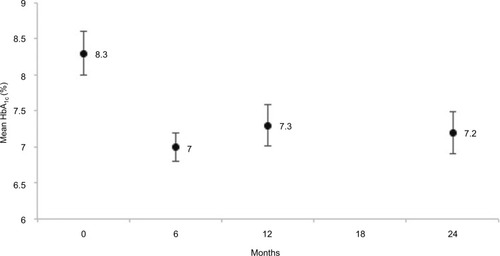
Table 2 Diet composition (g/day) as estimated from 3-day food record among completers (n=51) at baseline and at 2 years