
Figures & data
Table 1 Characteristics of participants defined as nonobese and obese using obesity measures
Figure 1 Correlation plots of body mass index (BMI) versus percentage of body fat (PBF) in (A) all participants; (B) men; and (C) women.
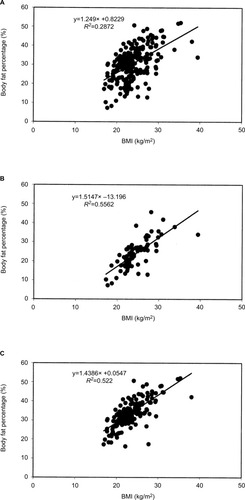
Table 2 Characteristics of participants by group, as classified by BMI and PBF
Table 3 Comparison of metabolic biomarkers between groups defined using different obesity measures
Figure 2 Multinomial logistic regression analysis for (A) hypertension, (B) insulin resistance, (C) impaired fasting glucose, (D) increased HbA1c, (E) hypertriglyceridemia, (F) hypo HDL cholesterolemia, (G) atherogenic lipoproteins, and (H) atherogenic lipoprotein pattern for the following groups compared with the reference normal-weight and lean group (Group A): overweight and lean (Group B), BMI ≥25.0 kg/m2 for women and ≥27.0 kg/m2 for men, and PBF <35% for women and <25% for men; normal weight and fat (Group C), body mass index (BMI) <25.0 kg/m2 for women and <27.0 kg/m2 for men, and percentage of body fat (PBF) ≥35% for women and ≥25% for men; and overweight and fat (Group D), BMI ≥25.0 kg/m2 for women and ≥27.0 kg/m2 for men, and PBF ≥35% for women and ≥25% for men.
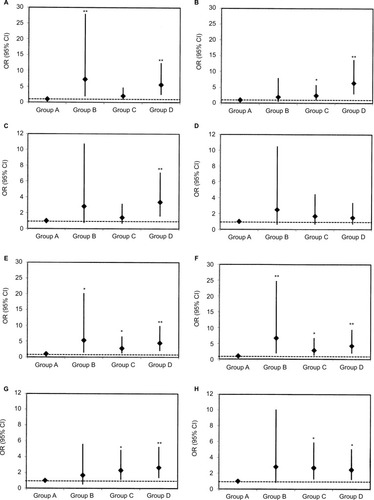
Table 4 Logistic regression analysis of obesity measures associated with CVD risk factors