Figures & data
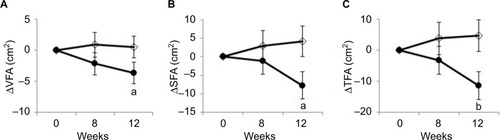
Figure 1 Flowchart illustrating the phases of the study.
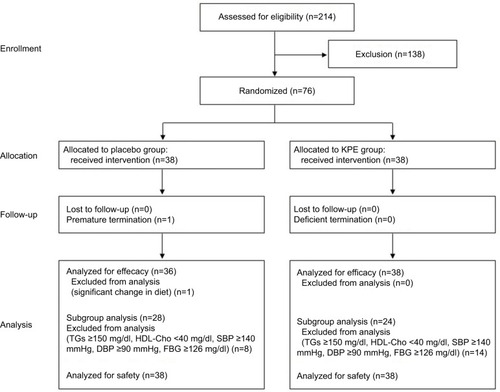
Table 1 Composition and nutritional content of test foods
Table 2 Characteristics of the subjects at baseline
Table 3 Changes in energy intake and physical activity after daily intake of test foods
Table 4 Changes in physical parameters after daily intake of test food
Table 5 Changes in physical parameters in healthy subjects (excluding subjects with dyslipidemia, hypertension, and hyperglycemia)
Table 6 Changes in blood pressure and heart rate after daily intake of test food
Table 7 Changes in biochemical parameters after daily intake of test food
Table 8 Changes in blood electrolyte levels after daily intake of test food
Table 9 Changes in hematologic parameters after daily intake of test food
Table 10 Changes in urinalysis parameters after daily intake of test food
Figure 2 Changes in abdominal fat area after daily intake of test food.
Abbreviations: KPE, Kaempferia parviflora extract; SFA, subcutaneous fat area; TFA, total fat area; VFA, visceral fat area.