
Figures & data
Figure 1 A heat map of the top 10 upregulated DEGs and top 10 downregulated DEGs in 57 non-T2D islet samples and 20 T2D islet samples.
Abbreviations: DEGs, differentially expressed genes; T2D, type 2 diabetes.
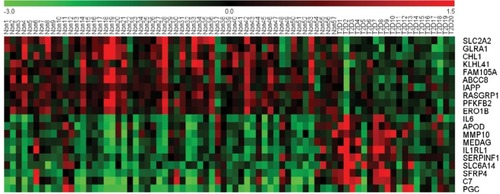
Figure 2 Enrichment analyses for (A) GO terms (referred to as pathways) and (B) KEGG pathways of DEGs in T2D.
Abbreviations: DEGs, differentially expressed genes; GO, gene ontology; KEGG, Kyoto Encyclopedia of Genes and Genomes; T2D, type 2 diabetes.
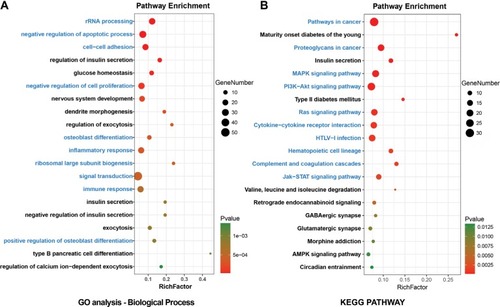
Figure 3 A PPI network for T2D based on 957 DEGs constructed by Cytoscape.
Abbreviations: DEGs, differentially expressed genes; PPI, protein–protein interaction; T2D, type 2 diabetes.
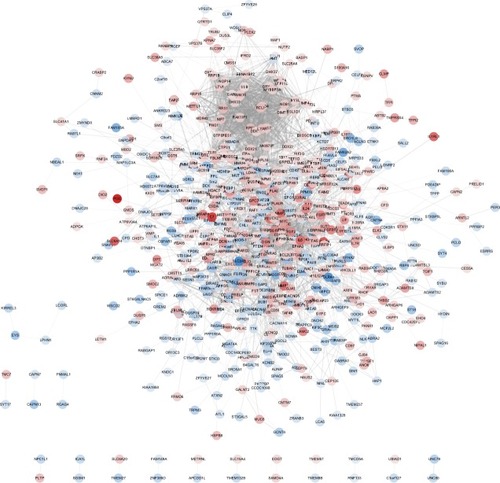
Figure 4 Top three modules identified from the PPI network by Cytoscape (A, C, and E) and gene annotation enrichment analysis of biological process GO category for each module (B, D, and F).
Abbreviations: GO, Gene Ontology; PPI, protein–protein interaction.
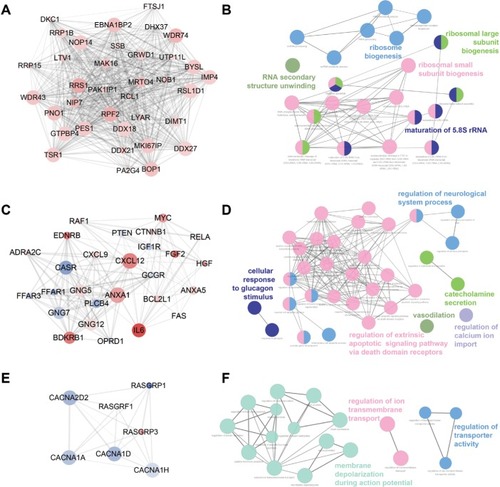
Figure 5 Sample clustering and module detection.
Abbreviations: T2D, type 2 diabetes; TOM, topological overlap matrix; WGCNA, weighted correlation network analysis.
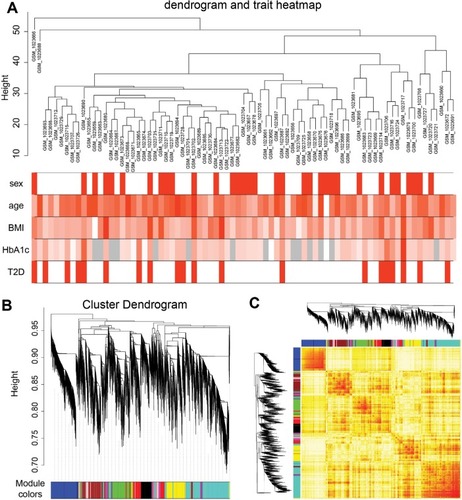
Figure 6 Correlation between modules and T2D.
Abbreviation: T2D, type 2 diabetes.
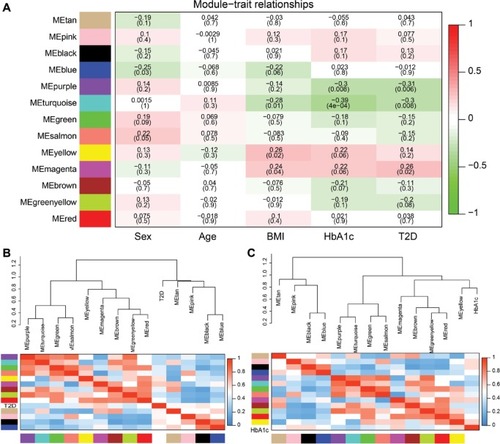
Figure 7 Gene annotation enrichment analysis of KEGG pathway in each module.
Abbreviation: KEGG, Kyoto Encyclopedia of Genes and Genomes.
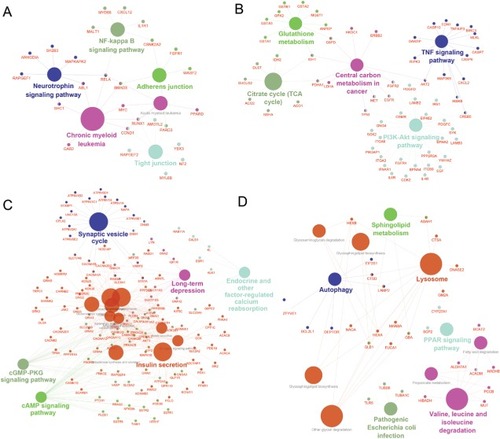
Figure S1 GO analysis classified the DEGs ([A] upregulated DEGs and [B] downregulated DEGs) into cellular component and molecular function of T2D. Abbreviations: DEG, differentially expressed genes; GO, Gene Ontology; T2D, type 2 diabetes.
![Figure S1 GO analysis classified the DEGs ([A] upregulated DEGs and [B] downregulated DEGs) into cellular component and molecular function of T2D. Abbreviations: DEG, differentially expressed genes; GO, Gene Ontology; T2D, type 2 diabetes.](/cms/asset/4f9e7912-4d49-4215-9de9-4a3f3fa18ea9/dmso_a_178894_s0001_c.gif)