Figures & data
Table 1 Literature search
Figure 1 PRISMA.
Source: From Mohen D, Liberati A, Tetzlaff J, Altman DG, The PRISMA Group (2009). Preferred Reporting Items for Systematic Reviews and Meta-Analyses: The PRISMA Statement. PLoS Med 6(6):e1000097. doi:10.1371/journal.pubmed1000097. For more information, visit www.prisma-statement.org.
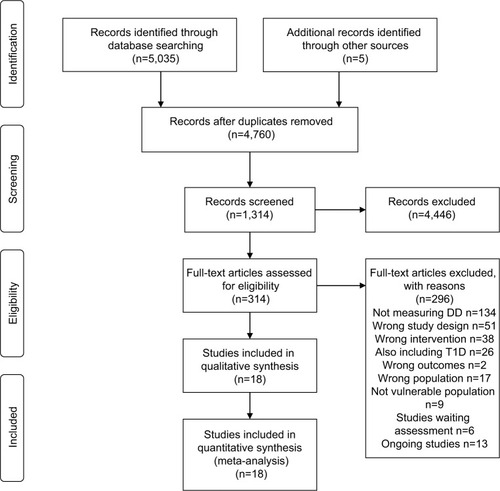
Table 2 Characteristics of included studies
Figure 2 Meta-analysis: intervention vs standard care on diabetes distress at 3, 6, 12, and 24 months follow-up; (1) Means converted from scale with range 0-100 with positive outcomes reflecting a higher number; (2) 24 weeks follow-up; (3) SDs calculated from Cls using Revman 5.3; (4) Measured DDS at 8 months FU (ITT); (5) SDs calculated from SE using Revman 5.3; (6) Significant difference at baseline; PAID 59.9 intervention group versus 42.3 in the control group; (7) Means+SDs from Cochrane review (Chew et al. 2017); (8) Measured with DDS at 9 months follow-up; (9) online care (intervention) versus web training (control); (10) Means+SDs from Cochrane review (chew et al. 2017); (11) Measured with DDS (ITT). Risk of bias legend: (A) Random sequence generation (selection bias); (B) Allocation concealment (selection bias); (C) Blinding of participants and personnel (performance bias); (D) Blinding of outcome assessment (detection bias); (E) Incomplete outcome data (attrition bias); (F) Selective reporting (reporting bias); (G) Other bias.
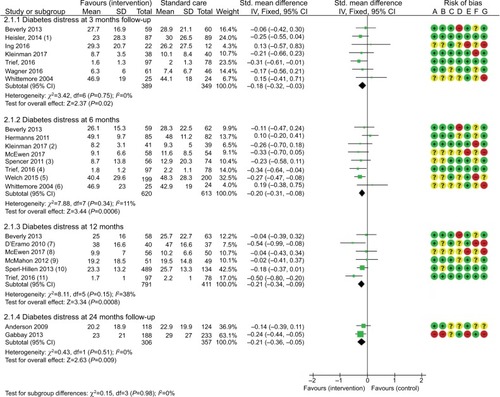
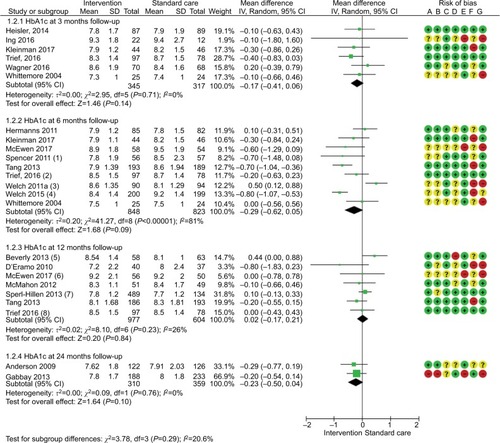
Figure 3 Meta-analysis: intervention vs standard care on HbA1c at 3, 6, 12, and 24 months follow-up; (1) SDs calculated from CI using Revman 5.3; (2) At 8 months followup (ITT); (3) Mean+SDs calculated from within group differences; (4) SDs Calculated from SE using Revman 5.3; (5) Means+SDs from Cochrance review (Chew et al. 2017); (6) At 9 months follow-up; (7) Means+SDs from Cochrance review (Chew et al. 2017); (8) ITT; Risk of bias legend; (A) Random sequence generation (selection bias); (B) Allocation concealment (selection bias); (C) Blinding of participants and personnel (performance bias); (D) Blinding of outcome assessment (detection bias); (E) Incomplete outcome data (attrition bias); (F) Selective reporting (reporting bias); (G) Other bias