Figures & data
Table 1 Clinical characteristics of participants
Figure 1 Expression of ABCA1, adiponectin and GLUT4 in the adipose tissue from individuals who were lean and individuals who were obese.
Notes: Expression of (A) abca1 (P=0.04 and 0.4), adipoq (P=0.001 and 0.5) and glut4 (slc2a4) (P=0.0004 and 0.0002) at the mRNA level in specified adipose tissue compartments from individuals who were lean and obese. Expression levels normalized to geometric mean of three reference genes (actb, hprt1 and polr2a). Statistical test: Wilcoxon rank sum test (P-value: ns = not significant, *P<0.05, **P<.01, ***P<0.001. (B) Representative images of immunohistochemical staining for ABCA1 in specified adipose tissue compartments. Magnification 10×. Scale bar =100 µm. (C) Heat map showing immunoreactivity scoring for the expression of ABCA1 and GLUT4 (SLC2A4) at the protein level in visceral and subcutaneous adipose tissue compartments from individuals who were lean and obese (lean, n=28; obese, n=34).
Abbreviation: ns, nonsignificant.
Abbreviation: ns, nonsignificant.
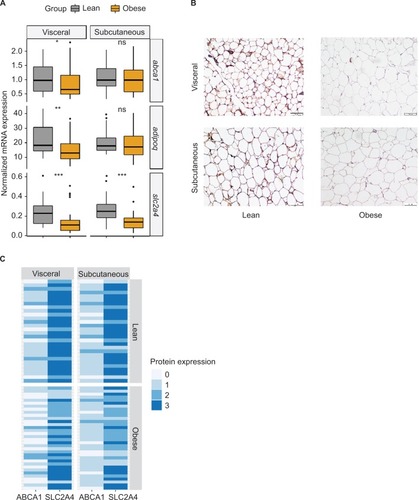
Table 2 Clinical characteristics of individuals grouped as insulin sensitive and insulin resistant
Figure 2 Expression of ABCA1, adiponectin and GLUT4 in adipose tissue from IS and IR individuals.
Notes: Expression of (A) abca1 (P=0.0001 and 0.97), adipoq (P=0.04 and 0.24) and glut4 (slc2a4) (P=0.001 and 0.008) at the mRNA level. (B) Heat map showing immunoreactivity scoring for ABCA1 and GLUT4 (SLC2A4) in specified adipose tissue compartments from individuals who were IS and IR (IS, n=36; IR, n=26). (C) Expression of abca1 mRNA and (D) protein in visceral adipose tissue compartment in specified groups (n=23, 13 and 21, respectively). Statistical test: Wilcoxon rank sum test (P-value: *P<0.05, **P<.01, ***P<0.001.
Abbreviations: IR, insulin resistant; IS, insulin sensitive; ns, not significant.
Abbreviations: IR, insulin resistant; IS, insulin sensitive; ns, not significant.
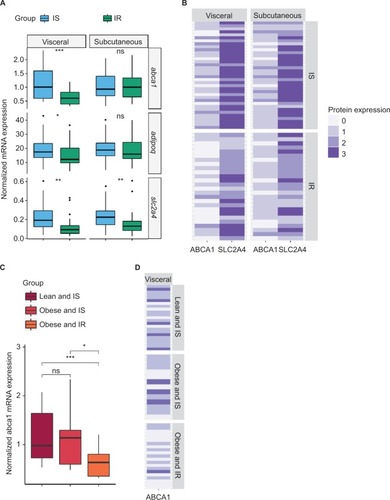
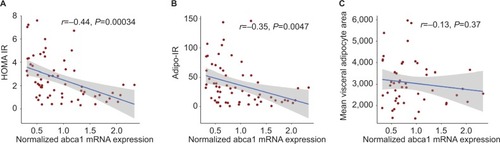
Figure 3 Correlation between abca1 mRNA expression in the visceral adipose tissue with insulin resistance markers and mean adipocyte area.
Notes: Correlation between abca1 mRNA in the visceral adipose tissue with (A) HOMA-IR (n=62) and (B) adipo-IR (n=62). (C) Correlation between mean visceral adipocyte area in µm2 and abca1 mRNA expression in the visceral adipose tissue (n=48). Statistical test: Pearson correlation.
Abbreviations: adipo-IR, adipose tissue insulin resistance; HOMA-IR, homeostatic model assessment for insulin resistance.
Abbreviations: adipo-IR, adipose tissue insulin resistance; HOMA-IR, homeostatic model assessment for insulin resistance.