
Figures & data
Figure 1 Experimental design and oral glucose tolerance test.
Abbreviations: DJB, duodenal–jejunal bypass; DJB group, MCD–HF diet for 3 months followed by DJB and MCD–HF diet for subsequent 3 months; HF, high fat; HFD, high fat diet; HF group, MCD–HF diet; MCD, methionine–choline-deficient; NC group, normal chow; PGZ group, MCD–HF diet for 3 months followed by treatment with PGZ with MCD–HF diet for subsequent 3 months; PGZ, pioglitazone.
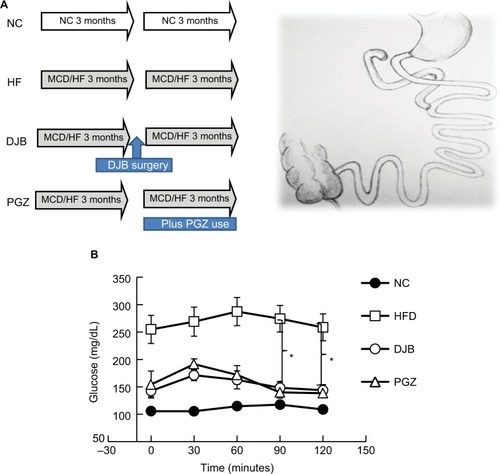
Table 1 Effects of DJB and PGZ on metabolic parameters in MCD and HF diet-induced rats of nonalcoholic steatohepatitis
Figure 2 H&E staining of liver tissue after the 6-month protocol.
Abbreviations: DJB, duodenal–jejunal bypass; DJB group, MCD–HF diet for 3 months followed by DJB and MCD–HF diet for subsequent 3 months; HF, high fat; HF group, MCD–HF diet; MCD, methionine–choline-deficient; NC group, normal chow; PGZ group, MCD–HF diet for 3 months followed by treatment with PGZ with MCD–HF diet for subsequent 3 months; PGZ, pioglitazone.
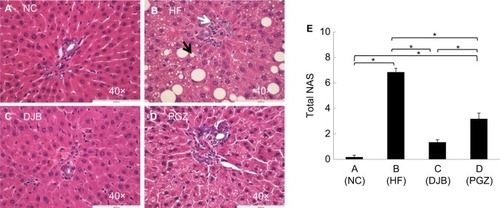
Table 2 NAFLD activity score (NAS) in each group
Figure 3 H&E staining of visceral epididymal fat tissue after 6 months.
Abbreviations: DJB, duodenal–jejunal bypass; DJB group, MCD–HF diet for 3 months followed by DJB and MCD–HF diet for subsequent 3 months; HF, high fat; HF group, MCD–HF diet; MCD, methionine–choline-deficient; NC group, normal chow; PGZ group, MCD–HF diet for 3 months followed by treatment with PGZ with MCD–HF diet for subsequent 3 months; PGZ, pioglitazone.
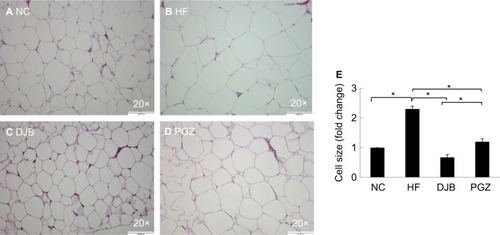
Figure 4 α-SMA expression after 6 months.
Abbreviations: DJB, duodenal–jejunal bypass; DJB group, MCD–HF diet for 3 months followed by DJB and MCD–HF diet for subsequent 3 months; HF, high fat; HF group, MCD–HF diet; MCD, methionine–choline-deficient; NC group, normal chow; PGZ group, MCD–HF diet for 3 months followed by treatment with PGZ with MCD–HF diet for subsequent 3 months; PGZ, pioglitazone.
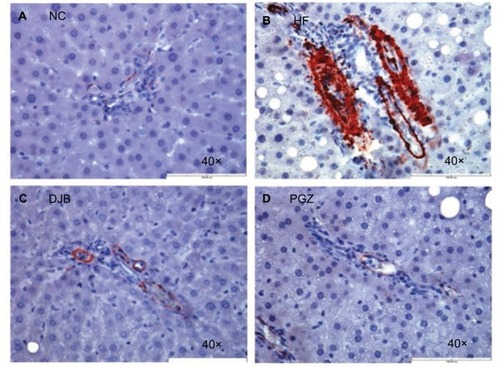
Figure 5 Masson’s trichrome stain for collagen bundle.
Abbreviations: DJB, duodenal–jejunal bypass; DJB group, MCD–HF diet for 3 months followed by DJB and MCD–HF diet for subsequent 3 months; HF, high fat; HF group, MCD–HF diet; MCD, methionine–choline-deficient; NC group, normal chow; PGZ group, MCD–HF diet for 3 months followed by treatment with PGZ with MCD-HF diet for subsequent 3 months; PGZ, pioglitazone.
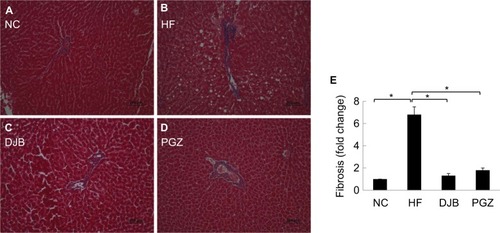
Figure 6 (A) mRNA expression of fibrogenesis gene. TGF-β1 was significantly downregulated by DJB and PGZ. (B) mRNA expression of lipogenesis gene. SREBF-1 was not improved by DJB or PGZ. Each value is expressed as mean ± standard error of the mean (n=6). *P<0.05. (C) DJB increased LC3 expression (lane 1: NC group; lanes 2 and 3: DJB group; lane 4: HF group). The presenting grouping blots [LC3 or β-actin] were cropped from the same field of the same gel. (D) Quantitative evaluation of LC3 expression by fold change. *P<0.05.
![Figure 6 (A) mRNA expression of fibrogenesis gene. TGF-β1 was significantly downregulated by DJB and PGZ. (B) mRNA expression of lipogenesis gene. SREBF-1 was not improved by DJB or PGZ. Each value is expressed as mean ± standard error of the mean (n=6). *P<0.05. (C) DJB increased LC3 expression (lane 1: NC group; lanes 2 and 3: DJB group; lane 4: HF group). The presenting grouping blots [LC3 or β-actin] were cropped from the same field of the same gel. (D) Quantitative evaluation of LC3 expression by fold change. *P<0.05.](/cms/asset/ad73625e-4a2f-4a47-b7bf-091c06a8a023/dmso_a_190631_f0006_b.jpg)