Figures & data
Figure 1 Whole-body ERαKO mice reduce adiposity, increase glucose tolerance and exhibit enhanced beiging following cold-exposure. Four-month-old female ERαWT (WT) and ERαKO (KO) mice were subjected to cold-exposure (6 °C) for 7 days or maintained at RT (23 °C). (A) Body weight, n≥12. (B) Fat mass by NMR, n≥8. (C) Fat content by NMR, n≥8. (D) Relative fat mass loss in SWAT and VWAT compartments of WT and KO females were calculated according to white adipose depot weights (see Figure S1B): SWAT = Cold (2*IGW + ISCW) – RT (2*IGW + ISCW); VWAT = Cold (2*PGW + 2*RPW + MWAT) − RT(2*PGW + 2*RPW + MWAT), n≥8. (E) Blood glucose levels of WT and KO females, n≥6. (F) Glucose tolerance tests were performed in WT and KO females at RT (a week prior to cold-exposure) and immediately after cold-exposure. Mice were fasted, i.p. injected with 1.25 g/kg glucose, and their glucose levels were monitored, n≥8. Inset – areas under curve. (G–H) Representative H&E-stained histological sections of SWAT (G) and BAT (H), n≥8. (I–J) Relative mRNA levels, quantified by qPCR, of brown/beige adipocyte markers expressed in SWAT (IGW, I) and BAT (J) of WT and KO females at cold, n≥6. Scale bars =100 µm. Error bars indicate S.E.M. Statistical significance assessed by two-tailed student’s t-test, *p<0.05, **p<0.01, NS, not significant; and one-way ANOVA test, $p<0.01.
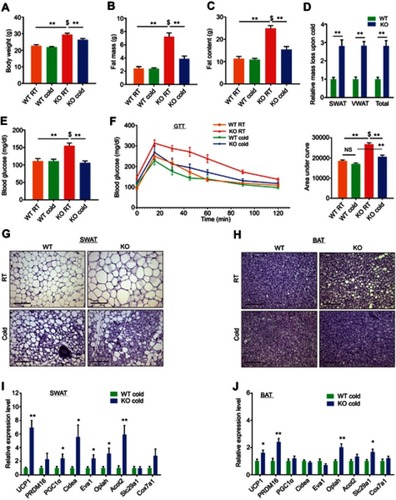
Figure 2 Ovariectomized females reduce adiposity, increase glucose tolerance and exhibit enhanced beiging following cold-exposure. Two-month-old female mice underwent sham operation or ovariectomy (OVX), 3 months later, both groups were either subjected to cold-exposure (6 °C) for 7 days or maintained at RT (23 °C). (A) Body weight, n≥11. (B) Fat mass by NMR, n≥6. (C) Fat content by NMR, n≥6. (D) Relative fat mass loss in SWAT and VWAT compartments of Sham and OVX females were calculated according to white adipose depot weights (see Figure S3B): SWAT = Cold (2*IGW + ISCW) – RT (2*IGW + ISCW); VWAT = Cold (2*PGW + 2*RPW +MWAT) – RT (2*PGW + 2*RPW + MWAT), n≥8. (E) Blood glucose levels of Sham and OVX females, n≥8. (F) Glucose tolerance tests were performed in Sham and OVX females at RT (a week prior to cold-exposure) and immediately after cold-exposure. Mice were fasted, i.p. injected with 1.25 g/kg glucose, and their glucose levels were monitored, n≥9. Inset – areas under curve. (G) Representative H&E-stained histological sections of SWAT, n≥8. (H–I) Relative mRNA levels, quantified by qPCR, of brown/beige adipocyte markers expressed in SWAT (IGW) (H) and BAT (I) at cold, n≥6. (J) Representative H&E-stained histological sections of the liver. Scale bars =100 µm. Error bars indicate S.E.M. Statistical significance assessed by two-tailed Student’s t-test, *p<0.05, **p<0.01, NS, not significant; and one-way ANOVA test, $p<0.01.
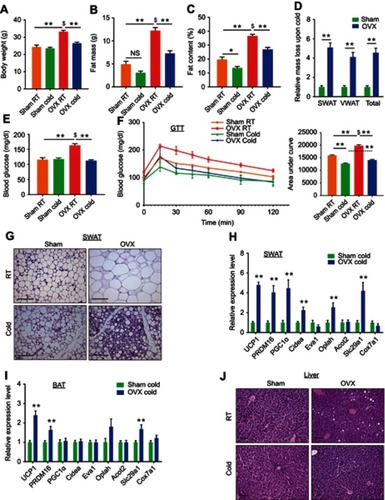
Figure 3 Fulvestrant enhances beiging in vitro and in vivo. (A–C) Stromal-vascular (SV) cells were isolated from SWAT of two-month-old females. (A) Confluent cells were treated daily with a vehicle or Fulvestrant for 48 hr, and immunostained for ERα expression. (B–C) Confluent cells were induced with beige adipogenic media in the presence of vehicles, Fulvestrant or Estradiol. A week later, beige cells were activated with Forskolin. Beiging was assessed by UCP1 immunostaining (B) or relative mRNA levels, quantified by qPCR, of brown/beige adipocyte markers, n≥7 (C). Nile Red stains lipid droplets. (D–J) Acute administration: Four-month-old WT females were given a vehicle or 40 mg/kg/injection Fulvestrant as described in (D), then they were subjected to cold-exposure (6 °C) for 7 days or maintained at RT (23 °C). (E) Representative photographs of IGW adipose depots of vehicle-treated and Fulvestrant-treated females at cold. (F) Relative fat mass loss in SWAT and VWAT compartments of vehicle-treated and Fulvestrant-treated females were calculated according to white adipose depot weights (see Figure S5F): SWAT = Cold (2*IGW + ISCW) – RT (2*IGW + ISCW); VWAT = Cold (2*PGW + 2*RPW + MWAT) − RT(2*PGW+2*RPW+MWAT), n≥7. (G) Representative H&E-stained histological sections of SWAT, n≥7. (H) UCP1 immunohistochemistry (upper lane) and immunofluorescence (lower lane) - representative sections of SWAT at cold. (I–J) Relative mRNA levels, quantified by qPCR, of brown/beige adipocyte markers expressed in SWAT (IGW) (I) and BAT (J) at cold, n≥5. (K) Vehicle or Fulvestrant administration in four-month-old ERαKO (KO) females in a similar manner to the WT females, as described in (D), followed by cold-exposure (6 °C) for 7 days. Relative mRNA levels, quantified by qPCR, of UCP1 in SWAT (IGW) and BAT, n≥5. Histological morphology confirms no difference in beiging between vehicle-treated and Fulvestrant-treated KO mice (not shown). Scale bars =100 µm. Error bars indicate S.E.M. Statistical significance assessed by two-tailed Student’s t-test, *p<0.05, **p<0.01; and one-way ANOVA test, $p<0.01.
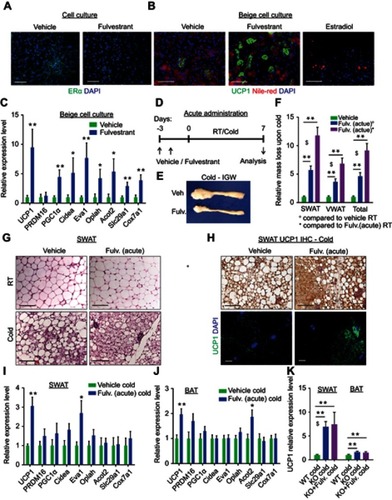
Figure 4 Chronic Fulvestrant treatment reduces adiposity. (A–I) Chronic administration: four-month-old WT ICR(CD1) females were given a vehicle or 40 mg/kg/injection Fulvestrant for a month, then they were subjected to cold-exposure (6 °C) for 7 days or maintained at RT (23 °C), as described in (A). (B) Body weight, n≥6. (C) Fat mass by NMR, n≥6. (D) Fat content by NMR, n≥6. (E) Representative photographs of IGW and PGW adipose depots of vehicle-treated and Fulvestrant-treated females at cold. (F) Weight of indicated fat depots in vehicle-treated and Fulvestrant-treated females: SWAT - IGW and ISCW; VWAT - PGW, RPW and MWAT; and intrascapular BAT, n≥6. (G) Relative fat mass loss in SWAT and VWAT compartments of vehicle-treated and Fulvestrant-treated females were calculated according to white adipose depot weights (see ): SWAT = Cold (2*IGW + ISCW) − RT (2*IGW + ISCW); VWAT = Cold (2*PGW + 2*RPW + MWAT) – RT (2*PGW + 2*RPW + MWAT), n≥6. (H) Blood glucose levels of vehicle-treated and Fulvestrant-treated females, n≥6. (I) In vivo glucose uptake assay, based on radiolabeled 2-DG administration, in vehicle-treated and Fulvestrant-treated females upon cold-exposure (see methods for further details), n≥5. Error bars indicate S.E.M. Statistical significance assessed by two-tailed Student’s t-test, *p<0.05, **p<0.01, NS, not significant; and one-way ANOVA test, $p<0.01.
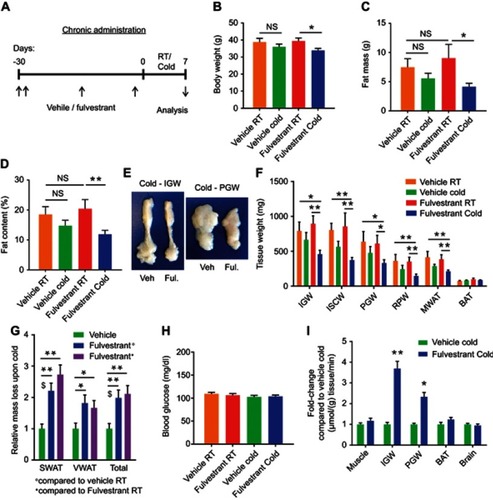
Figure 5 Chronic Fulvestrant treatment enhances cold-induced beiging. Chronic administration, as described in . (A–B) Representative H&E-stained histological sections of SWAT (A) and VWAT (B), n≥7. (C–D) UCP1 immunohistochemistry (upper lane) and immunofluorescence (lower lane) - representative sections of SWAT (C) and VWAT (D) at cold. (E–G) Relative mRNA levels, quantified by qPCR, of brown/beige adipocyte markers expressed in SWAT (IGW) (E), VWAT (PGW) (F) and BAT (G) at cold, n≥8. (H) Body temperature (rectal probe) of vehicle-treated and Fulvestrant-treated females at RT and cold, n≥6. Scale bars =100 µm. Error bars indicate S.E.M. Statistical significance assessed by two-tailed Student’s t-test, *p<0.05, **p<0.01; and one-way ANOVA test, $p<0.01.
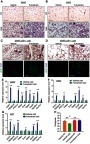
Figure 6 Fulvestrant treatment improves the metabolism of diet-induced obese/diabetic mice. (A–K) Chronic administration in a high-fat diet (HFD) model: at the age of two-month-old onwards, WT female mice were fed with high-fat high-sucrose diet. Two months later, as described in (A), the females were given a vehicle or 40 mg/kg/injection Fulvestrant for a month, then they were subjected to cold-exposure (6 °C) for 7 days or maintained at RT (23 °C). (B) Body weight, n≥11. (C) Fat mass by NMR, n≥17. (D) Blood glucose levels of vehicle-treated and Fulvestrant-treated females on HFD, n≥7. (E–F) Glucose tolerance (E) and insulin tolerance (F) tests were performed in vehicle-treated and Fulvestrant-treated females on HFD at RT (a week prior to cold-exposure) and immediately after cold-exposure. Mice were fasted, i.p. injected with 1.25 g/kg glucose (E) or 0.75 mU/g insulin (F), and their glucose levels were monitored, n≥8. Insets – areas under curve. (G) Representative H&E-stained histological sections of BAT, n≥7. (H–I) Relative mRNA levels, quantified by qPCR, of brown/beige adipocyte markers expressed in SWAT (IGW) (H), and BAT (I) at cold, n≥6. (J) Body temperature (rectal probe) of vehicle-treated and Fulvestrant-treated females on HFD at RT and cold, n≥7. (K) Representative H&E-stained histological sections of the liver. Scale bars =100 µm. Error bars indicate S.E.M. Statistical significance assessed by two-tailed Student’s t-test, *p<0.05, **p<0.01, NS, not significant; and one-way ANOVA test, $p<0.01.
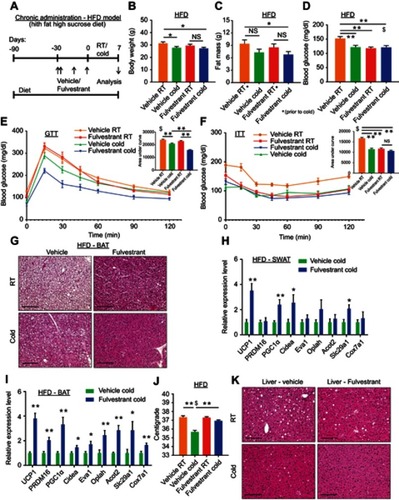
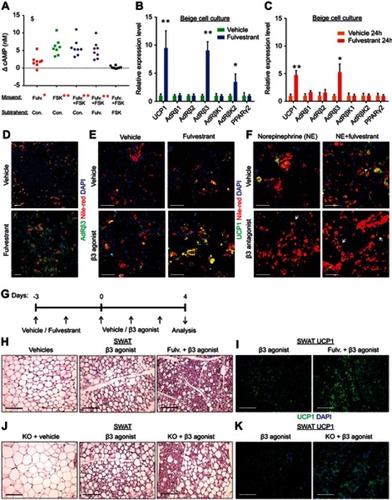
Figure 7 Estrogen receptor inhibition promotes beiging via β3-adrenoreceptor. (A–F) SV cells were isolated from SWAT of two-month-old WT females. Confluent cells were induced with beige adipogenic media. A week later, the following experiments were performed. (A) Relative changes in cAMP concentrations upon induction with or without Forskolin. Every dot represents an average of technical triplicates of one biological sample. The relative changes in cAMP concentrations are calculated as differences between treatments, n≥8. (B–C) Relative mRNA levels, quantified by qPCR, of UCP1, β-adrenergic receptors, β-adrenergic receptor kinases and PPARγ2. (B) Vehicle or Fulvestrant were added during differentiation, then the differentiated beige cells were activated with Forskolin for 8 hr, n≥7. (C) Vehicle or Fulvestrant were added to differentiated beige cells for 24 hr without Forskolin, n≥5. (D–F) Vehicle or Fulvestrant were added during differentiation. Nile Red stains lipid droplets. (D) Vehicle-treated or Fulvestrant-treated beige cells were immunostained for AdRβ3 expression. (E) Vehicle-treated or Fulvestrant-treated beige cells were activated or not with CL-316,243 (β3 agonist) for 24 hr, and then immunostained for UCP1 expression. (F) Vehicle-treated or Fulvestrant-treated beige cells were activated with Norepinephrine (NE) for 24 hr; concomitantly co-treated with a vehicle or SR59230A (β3 antagonist), and then immunostained for UCP1 expression. (G–I) Four-month-old WT females were pre-treated with a vehicle or 40 mg/kg/injection Fulvestrant, followed by administration of 1 mg/kg/day β3 agonist as described in (G). Representative histological sections of SWAT, which were either H&E-stained (H), n≥8, or immunostained for UCP1 expression (I). (J–K) Four-month-old ERαWT or ERαKO (KO) females were treated with β3 agonist as described in (G). Representative histological sections of SWAT, which were either H&E-stained (J), n≥7, or immunostained for UCP1 expression (K). Scale bars =100 µm. Error bars indicate S.E.M. Statistical significance assessed by two-tailed Student’s t-test, *p<0.05, **p<0.01; and one-way ANOVA test, $p<0.01. In (A), results are based on a matched standard curve and a linear regression analysis.