Figures & data
Figure 1 Characteristic features of the pancreas in patients with SPIDDM. (A) Pancreatic intraductal papillous neoplasia (PanIN) lesion frequently observed in the patients with SPIDDM. Azan staining. PanIN lesion of pancreatic ducts (arrowheads) is associated with an atrophied, fibrous pancreatic lobe (stained blue), a dilated pancreatic duct (asterisk) and extensive mononuclear cell infiltration. (B) Insulitis in a patient with SPIDDM. CD45 (leukocyte common antigen) + mononuclear cells (MNCs) are infiltrated around (arrowheads) and into the islet cells (arrows). Most of the CD45+ cells are CD8+ T cells and CD68+ macrophages. Aida K, Fukui T, Jimbo E, et al. Distinct inflammatory changes of the pancreas of slowly progressive insulin-dependent (Type 1) Diabetes. Pancreas. 2018;47(9):1101–1109.Citation21
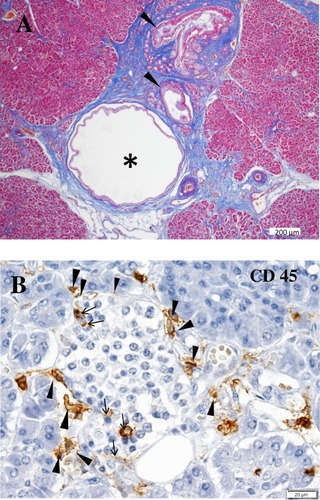
Figure 2 (A) Longitudinal changes of patients who progressed from the non-insulin-requiring stage to an insulin-dependent stage (IDS) in five study groups. IDS is defined as the state when integrated values of serum C-peptide levels at 0, 30, 60, 90, and 120 min during a 100-g oral glucose tolerance test (sigma C-peptide) reach <5 ng/mL. (B) Reduction rate of sigma C-peptide in group 1 (patients with GADAb titer ≥10 AU/mL [≥180 WHO U/mL]), group 2 (patients with GADAb titer <10 AU/mL [<180 WHO U/mL]), group 3 (patients without GADAb and with islet cell antibodies [ICA], group 4 (patients without GADAb or ICA antibodies and with insulin-associated antigen 2 antibodies [IA-2A]), and group 5 (patients with T2D without GADAb, ICA, or IA-2A antibodies).
![Figure 2 (A) Longitudinal changes of patients who progressed from the non-insulin-requiring stage to an insulin-dependent stage (IDS) in five study groups. IDS is defined as the state when integrated values of serum C-peptide levels at 0, 30, 60, 90, and 120 min during a 100-g oral glucose tolerance test (sigma C-peptide) reach <5 ng/mL. (B) Reduction rate of sigma C-peptide in group 1 (patients with GADAb titer ≥10 AU/mL [≥180 WHO U/mL]), group 2 (patients with GADAb titer <10 AU/mL [<180 WHO U/mL]), group 3 (patients without GADAb and with islet cell antibodies [ICA], group 4 (patients without GADAb or ICA antibodies and with insulin-associated antigen 2 antibodies [IA-2A]), and group 5 (patients with T2D without GADAb, ICA, or IA-2A antibodies).](/cms/asset/fea8ae36-7fe1-4e7d-b1bc-ab3f47500538/dmso_a_191007_f0002_b.jpg)
Table 1 Genes Associated Or Not Associated With SPIDDM Or LADA
Table 2 Prevalence Of Islet Cell Autoantibody Positivity Among Patients With Diabetes
Table 3 Clinical Characteristics Of SPIDDM Compared With AT1D And T2D
Table 4 Diagnostic Criteria For Slowly Progressive Insulin-Dependent Type 1 Diabetes Mellitus (2012)
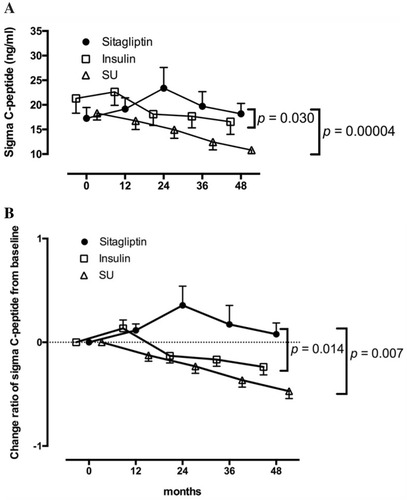
Figure 3 Longitudinal changes in the C-peptide response to the oral glucose tolerance test for 48 months in patients treated with sitagliptin in the Tokyo study. Patients with 48 months of follow-up are shown. Data are expressed as the mean ± SEM. In both the ∑C-peptide values (A) and change ratios from baseline (B), a repeated-measures analysis of variance revealed a significant interaction between time and treatment assignment (sitagliptin or insulin; p = 0.030 and p = 0.014, respectively) as well as between time and treatment assignment (sitagliptin or sulfonylurea; p = 0.00004 and p = 0.007, respectively) in the longitudinal changes.