
Figures & data
Table 1 Clinical and physiological characteristics of patients with nontransfusion-dependent thalassemia and control subjects
Figure 1 The percentage of patients with abnormal glucose homeostasis in nontransfusion-dependent thalassemia according to age distribution.
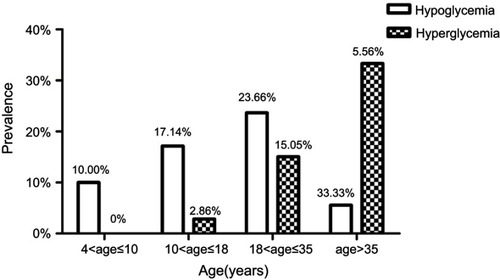
Table 2 Characteristics of nontransfusion-dependent thalassemia patients according to the presence of disorders of glucose metabolism
Figure 2 The percentage of patients with abnormal glucose homeostasis in nontransfusion-dependent thalassemia with according to their serum ferritin levels (SF) and liver iron concentrations (LIC).
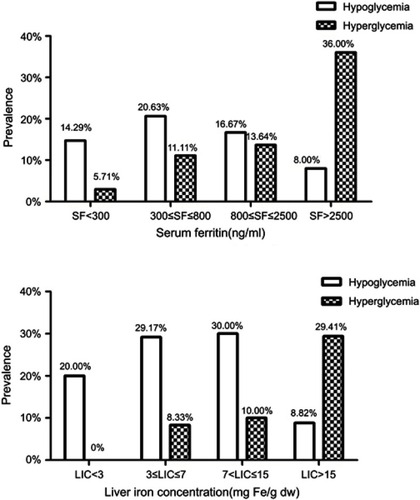
Figure 3 Compare (A) half-hour postprandial insulin (PINS30); (B) early phase insulinogenic index (IGI30); (C) late phase insulinogenic index (IGI120); (D) area under the curve of total insulin secretion (AUC-I) and (E) HOMA-IR index in nontransfusion-dependent thalassemia patients according to levels of LIC. *P<0.05, **P<0.01.
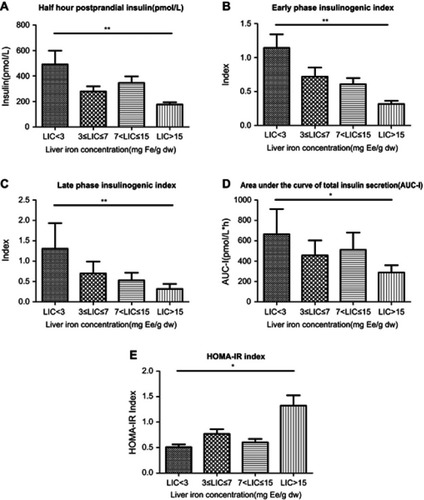
Figure 4 Correlation between 2 hrs postprandial glucose and (A) age (r=0.49; P<0.01); (B) 2 hrs postprandial insulin (r=0.55; P<0.01); (C) HOMA-IR index (r=0.17; P<0.05); (D) insulin sensitivity index (r=−0.19; P<0.05); (E) alanine aminotransferase (r=0.15; P<0.05); (F) liver iron concentration (r=0.30; P<0.01); (G) area under the curve of total insulin secretion (AUC-I) (r=0.30; P<0.01) in nontransfusion- dependent thalassemia patients.
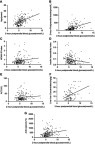
Table 3 Odds ratios for clinical and demographic factors associated with abnormal glucose homeostasis in nontransfusion dependent thalassemia patients