
Figures & data
Table 1 Baseline demographic and clinical characteristics of subjects who completed the hyperinsulinemic euglycemic clamp
Table 2 Baseline clinical characteristics and parameters of insulin sensitivity under hyperinsulinemic euglycemic clamp at 80 mU/m2·min
Table 3 Correlation of M-value normalized by fat-free masswith insulin, C-peptide and 2-hour glucose in oral glucose tolerance test according to age groups
Figure 1 Inverse relationship of M-value normalized by FFM with (A) baseline insulin (r=−0.418, P=0.047), (B) baseline C-peptide (r=−0.426, P=0.043) and (C) glucose at 2 hours during OGTT (r=−0.452, P=0.030).
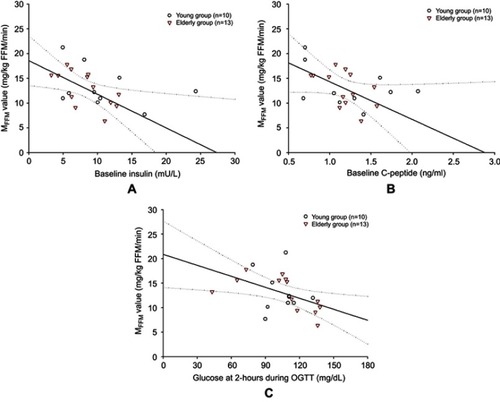
Table S1 Correlation of M-value normalized by body weight with insulin, C-peptide and 2-hour glucose in OGTT according to age groups
Table S2 Glucagon and GLP-1 related parameters during OGTT
Data availability
The datasets generated during the current study are available from the corresponding author on reasonable request.