
Figures & data
Figure 1 Schematic flow chart showing the selection process based on the inclusion and exclusion criteria.
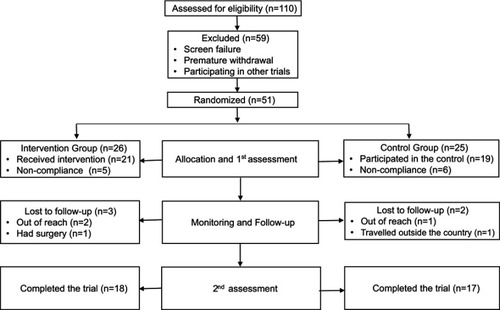
Figure 2 Schematic flow chart showing the site visits and telephone calls of the study.
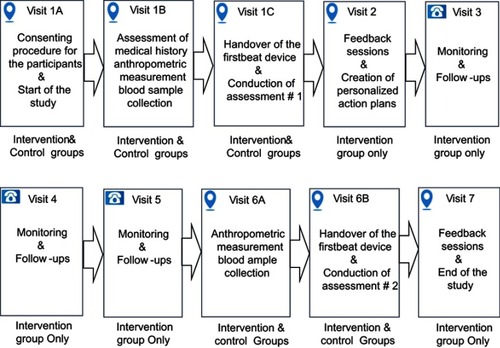
Table 1 Baseline demographic and clinical characteristics of the studied population (intervention and control groups)
Table 2 Percentage change in weight, BMI, HbA1c, and lipid profile between baseline and end of trial for intervention and control groups
Table 3 Percentage change in recovery, stress, and sleep duration and quality between baseline and end of trial for intervention and control groups
Data availability
Research data used in the preparation of the manuscript are available for sharing upon reasonable request. This includes the assessment tools and individual deidentified participant data. The data can be obtained from Dr Bashair M Mussa or https://clinicaltrials.gov.