Figures & data
Figure 1 Distribution of self-reported number of episodes of severe hypoglycemia during the preceding year in 1049 unselected subjects with type 1 diabetes (light bars) and 209 patients with type 1 diabetes selected by criteria to mimic the characteristics of the DCCT cohort (dark bars).
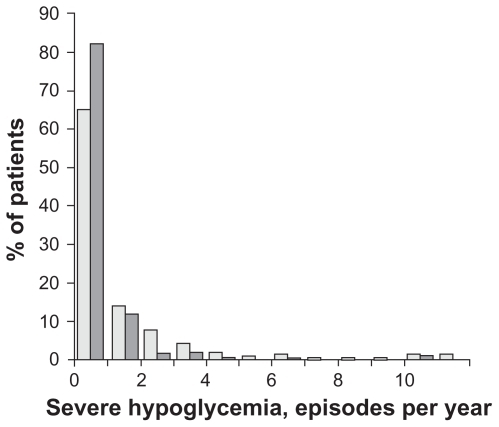
Figure 2 Causes identified by patients for severe hypoglycemic events (as % of group). White bar = total of all countries (type 1, 319; type 2, 320); black bar = UK (type 1, 101; type 2, 100), grey bar = Germany (type 1, 94; type 2, 120), dotted bar = Spain (type 1, 124; type 2, 100).
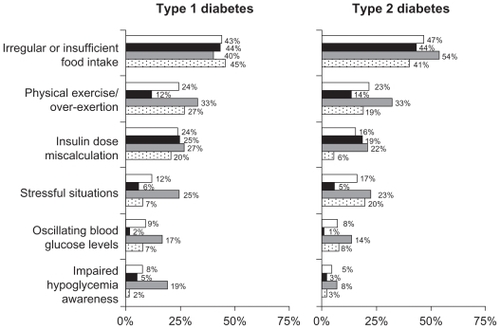
Table 1 Causes of hypoglycemia
Figure 3 Glycemic threshold levels for onset of acute hypoglycemia symptoms in nondiabetic subjects.
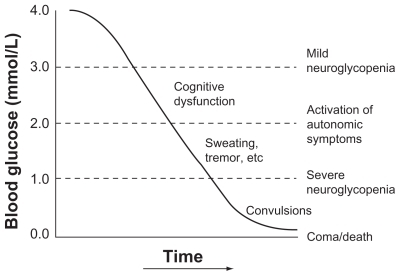
Table 2 Costs associated with severe hypoglycemia in three European countries (based on 2007 prices)
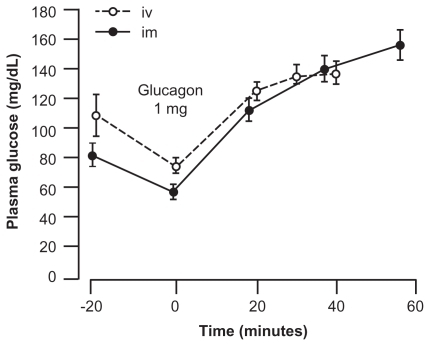
Figure 4 Changes in blood glucose levels before and after the administration of 1 mg biosynthetic glucagon.
Abbreviations: iv, intravenous; im, intramuscular.