Figures & data
Figure 1 Physiological and histological evaluation of HFD-induced NAFLD mice. Body weight (A) and fasting blood glucose (B) levels in HFD-induced NAFLD mice without Liraglutide treatment (mean±SD, n =12). Histological sections of liver tissues in the mice after 10 weeks of normal rodent chow diet and HFD feeding were represented in (C and D) (stained with HE, and ×400). *p<0.05 for comparison between NC and HFD groups.
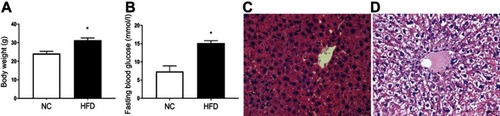
Figure 2 Body weight and fasting blood glucose levels in N+S, N+L, O+S and O+L groups before and after Liraglutide (L) or saline (S) treatment. Data were mean±SD (n=6 each group). (A) BW; (B) FBG level. *p<0.05 for before and after treatment.
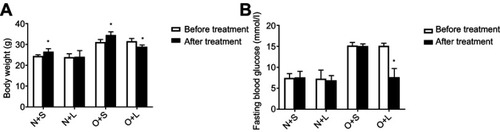
Figure 3 Body weight, fasting blood glucose levels, HOMA-IR scores, ALT and AST in mice after Liraglutide (L) or saline (S) treatment. Data were mean±SD (n=6 each group). (A) BW; (B) FBG level; (C) HOMA-IR score; (D) ALT; (E) p-values for the interactive effects of HFD and Liraglutide treatment on BWs, FBG levels, HOMA-IR scores, ALT and AST were 0.055, 0.001, 0.005, 0.185 and 0.001, respectively. *p<0.05 for comparison between saline and Liraglutide treatments. #p<0.05 for comparison between NC and HFD groups.
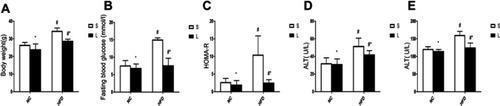
Figure 4 Histological evaluation of liver tissues with HE, Oil Red O staining, Mosson staining and transmission electron microscopy. Histological evaluation of liver tissues in each group stained with HE (×400), Oil Red O (×400) and Mosson staining (×400). Ultrastructural changes in liver tissues from each group (×10,000). ie, HE (A, E, I and M); Oil Red O (B, F, J and N); Mosson staining (D, H, L and P); transmission electron microscopy (C, G, K and O); N+S group (A, B, C and D); N+L group (E, F, G and H); O+S group (I, J, K and L); O+L group (M, N, O and P).
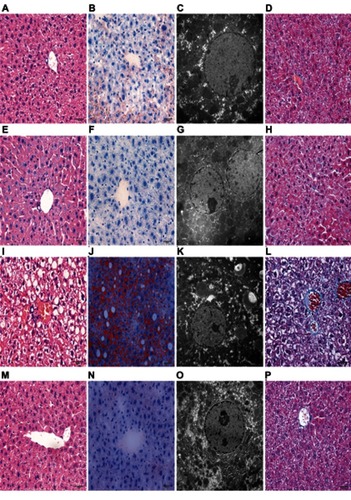
Figure 5 InsR, IGF-1R, IRS2, PI3K p85, Akt and α -SMA mRNA expression levels in mice after Liraglutide (L) or saline (S) treatment. Data were mean±SD (n=6 each group). p -values for the interactive effects of HFD and Liraglutide treatment on InsR, IGF-1R, IRS2, PI3K p85, Akt and α -SMA mRNA expression levels were 0.05, 0.338, 0.253, 0.53, 0.001 and 0.087, respectively. ie, InsR (A); IGF-1R (B); IRS2 (C); PI3K p85 (D); Akt (E); α -SMA (F). *p<0.05 for the comparison of the saline and Liraglutide groups; #p<0.05 for the comparison of NC and HFD groups.
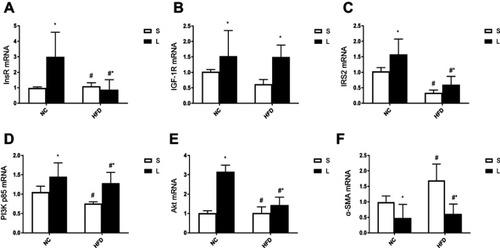
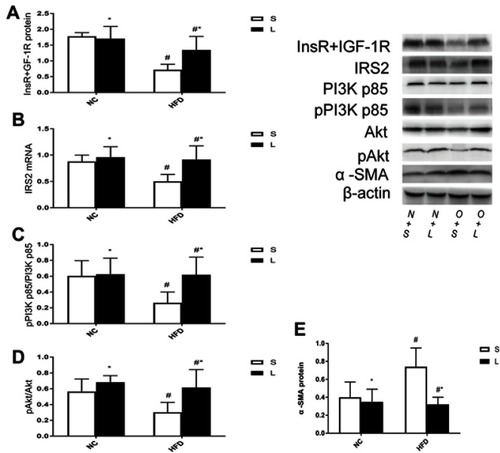
Figure 6 InsR+IGF-1R, IRS2, pPI3K p85/PI3K p85, p Akt/Akt and α -SMA levels in mice after Liraglutide (L) or saline (S) treatment. Data were mean±SD (n=6 each group). p-values for the interactive effects of HFD and Liraglutide treatment on InsR/IGF-1R, IRS2, pPI3K p85/PI3K p85, p Akt/Akt and α -SMA levels were 0.011, 0.039, 0.044, 0.114 and 0.01, respectively. ie, InsR/IGF-1R (A); IRS2 (B); pPI3K p85/PI3K p85 (C); p Akt/Akt (D); α -SMA (E). *p<0.05 for the comparison of the saline and Liraglutide groups; #p<0.05 for the comparison of NC and HFD groups.