
Figures & data
Figure 1 Frequency (%) of subjects by age group, according to obesity phenotypes, MHO and MUHO.
Abbreviations: MHO, metabolically healthy obese; MUHO, metabolically unhealthy obese.
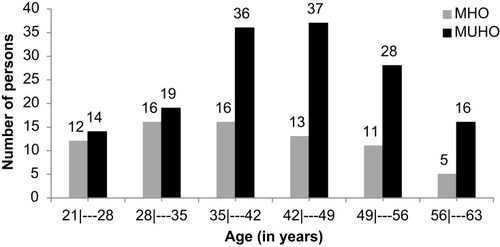
Table 1 Clinical, Biochemical And Anthropometric Characteristics Of The MHO And MUHO Phenotypes
Table 2 Correlation Between Bone Metabolism Variables And Anthropometric Parameters And Inflammatory Markers (HOMA-IR, Hs-CRP And Leptin) According To The MHO And MUHO Phenotypes