Figures & data
Figure 1 Sal dose-dependent alleviates PA-induced cell injury and lipid accumulation in hepatic L02 cells.
Notes: PA was added to the media at a final concentration of 400 μM in hepatic L02 cell lines and PA receiving varied concentrations of Salidroside (75μg/mL, 150μg/mL, 300μg/mL). (A) Cell viability. (B) ALT. (C) Oil red O staining (inverted phase-contrast microscope) and the positive area for Oil Red O staining. Data were shown as mean ± SD (n=3), ##P<0.01 vs normal group; *P<0.05, **P<0.01 vs PA group.
Abbreviations: PA, palmitic acid; ALT, alanine aminotransferase.
Abbreviations: PA, palmitic acid; ALT, alanine aminotransferase.
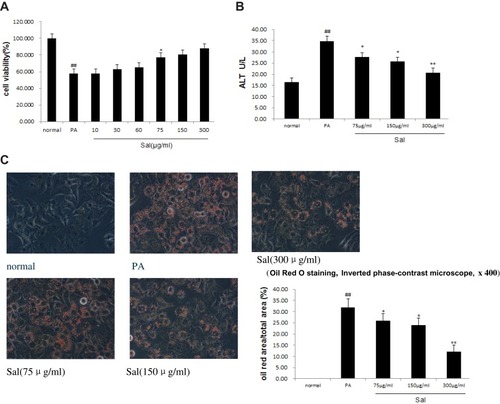
Figure 2 Sal dose-dependent inhibited TRPM2/CaCitation2+/CaMKIIpathway in L02 cells treated with PA.
Notes: PA was added to the media at a final concentration of 400 μM in hepatic L02 cell lines and PA receiving varied concentrations of Salidroside (75μg/mL, 150μg/mL, 300μg/mL). (A) Western blot analysis of TRPM2 protein. (B) qPCR analysis of TRPM2 mRNA. (C) Fluorescence intensity of [Ca2+]c was detected by flow cytometer with Fluo-3/AM. (D) Western blot analysis of p-CaMKII protein. Data were shown as mean ± SD (n=3), ##P<0.01 vs normal group; *P<0.05, **P<0.01 vs PA group. Abbreviations: PA, palmitic acid; TRPM2, transient receptor potential melastatin 2; CaMKII, calmodulin-stimulated protein kinaseII.
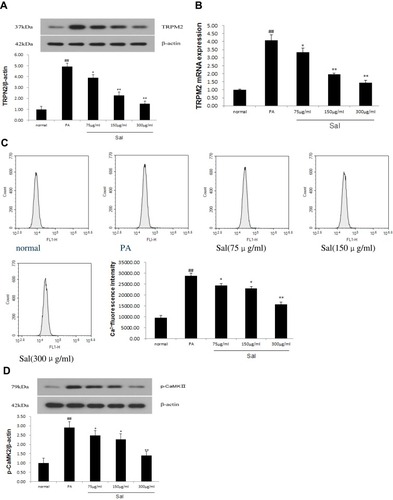
Figure 3 Sal reinforced autophagy in PA-stimulated hepatic L02 cells.
Notes: PA was added to the media at a final concentration of 400 μM in hepatic L02 cell lines and PA receiving varied concentrations of Salidroside (75μg/mL, 150μg/mL, 300μg/mL). (A) Western blot analysis showed that the dose dependence of Sal induced upregulation of the LC3B-II expression and the ratio of LC3B-II to I. (B) Western blot analysis showed that the dose dependence of Sal downregulated p62 expression. Data were shown as mean± SD (n=3), $p>0.05 vs normal group; †p>0.05 vs PA group; *p <0.05, **p <0.01 vs PA group.
Abbreviations: PA, palmitic acid; LC3B, Light chain 3B.
Abbreviations: PA, palmitic acid; LC3B, Light chain 3B.
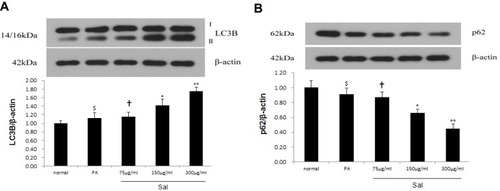
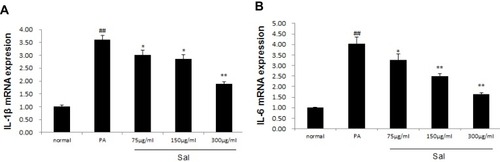
Figure 4 Sal down-regulated the expressions of IL-1β, IL-6 in L02 cells treated with PA.
Notes: PA was added to the media at a final concentration of 400 μM in hepatic L02 cell lines and PA receiving varied concentrations of Salidroside (75μg/mL, 150μg/mL, 300μg/mL). (A) qPCR analysis of IL-1β mRNA. (B) qPCR analysis of IL-6 mRNA. Data were shown as mean± SD (n=3), ##P<0.01 vs normal group; *P<0.05, **P<0.01 vs PA group.
Abbreviations: PA, palmitic acid; IL-1β, Interleukin1β; IL-6, Interleukin 6.
Abbreviations: PA, palmitic acid; IL-1β, Interleukin1β; IL-6, Interleukin 6.