Figures & data
Table 1 Anthropometric measurements of study subjects
Figure 1 Salivary concentration of obesity markers in comparison with normal weight (NW) and overweight/obese (OW/OB) participants. Magnetic Luminex performance multiplex assay shows the expression of (A) resistin (n=40 and 36), (B) CCL2/MCP-1 (n=40 and 36), (C) TNF-α (n=40 and 36), (D) IL-6 (n=40 and 31), (E) CRP (n=40 and 35), (F) IL-10 (n=40 and 33), and (G) complement Factor D/adipsin (n=40 and 36). Data are expressed with Box-Whisker plots with median, first (25th percentile) and third (75th) quartile range with minimum and maximum of the blot. ***p<0.0001 vs NW; **p<0.001 vs NW.
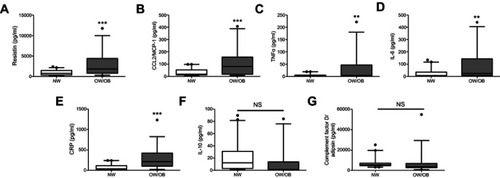
Table 2 Area under the curve derived by ROC curve analysis
Figure 2 Receiver operating characteristic (ROC) curve analysis demonstrating the discriminative value of the participating children in anthropometric and obesity markers such as CRP, IL-6, CCL2/MCP-1, resistin, and TNF-α. Diagonal solid line represents the reference line.
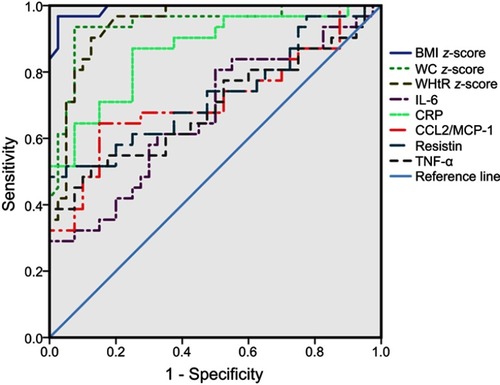
Table 3 Pairwise Pearson Correlation between salivary obesity biomarkers and anthropometric parameters
Figure 3 Result of linear regression analysis and Pearson correlation analysis between natural log-transformed CRP data and BMI z-score, WC z-score and WHtR z-score. Scatter plot represented with the p-value of 0.0001 for Pearson correlation coefficients.
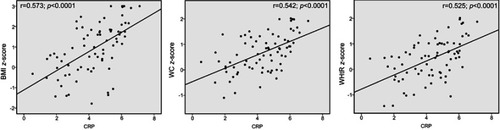
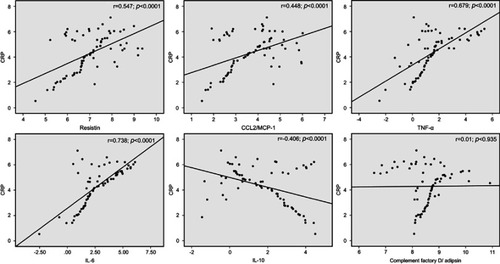
Figure 4 Evaluation of the correlation of natural log-transformed CRP with other obesity biomarkers. Scatter plot shows the correlation coefficient values with of CRP with resistin, CCL2/MCP-1, TNF-α, IL-6, IL-10, and complement factor D/adipsin.