Figures & data
Table 1 Patient demographics and baseline characteristics
Figure 1 24-hour glucose profiles of day 2 and day 3. Each point represents the mean± standard deviation of nine patients treated with insulin glargine (○) or detemir (▪).
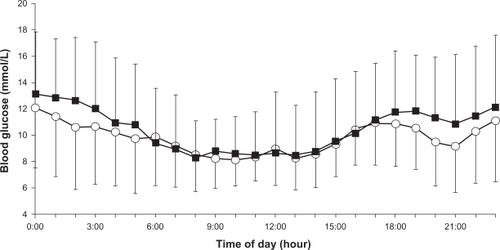
Table 2 Comparison of glargine CGM data with detemir CGM data
Figure 2 Comparison of the mean of daily difference (MODD) in nine patients treated with insulin glargine or detemir. The MODD value was significantly lower with insulin glargine than with insulin detemir.
Note: *P = 0.011.
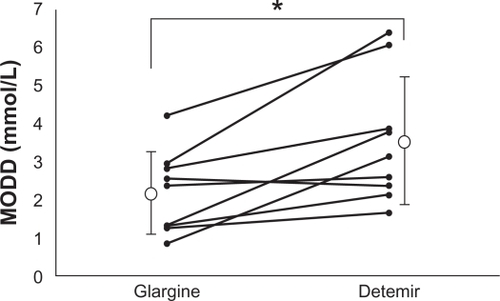
Table 3 Comparison of the intraday glycemic variability of glargine with that of detemir