
Figures & data
Table 1 General Baseline Characteristics Of Subjects Who Received Either Saffron Or Placebo
Figure 1 Schematic diagram of the study design; individuals in the intervention group received a tablet containing 100 mg of saffron per day during the study and those in the placebo group received 100 mg maltodextrin tablet at the same time.
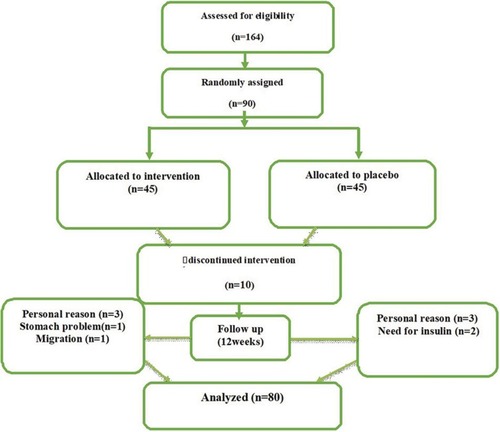
Table 2 Usual Dietary Intake Of Participants During The Study Who Received Either Saffron Or Placebo During The Study
Table 3 Physical Activity Measurements At The Study Baseline And 12 Weeks After Intervention In Two Groups
Table 4 Anthropometric Indices Measurement At Study Baseline And 12 Weeks After The Intervention In Subjects Who Received Either Saffron Or Placebo
Table 5 Glycemic Indices And Lipid Profiles Measurement At Study Baseline And 12 Weeks After The Intervention In Subjects Who Received Either Saffron Or Placebo
Table 6 Inflammatory Indices, Malondialdehyde And Total Antioxidant Capacity Measurement At Study Baseline And 12 Weeks After The Intervention In Subjects Who Received Either Saffron Or Placebo