Figures & data
Figure 1 Body weight and retroperitoneal fat mass in control (n=10) and HFD-M (n=10) rats. The comparison between CON and HFD-M groups in (A) Body weight; (B) body weight gain; (C)retroperitoneal fat weight; (D) retroperitoneal fat mass (% of total body weight). *P<0.05, **P<0.01.
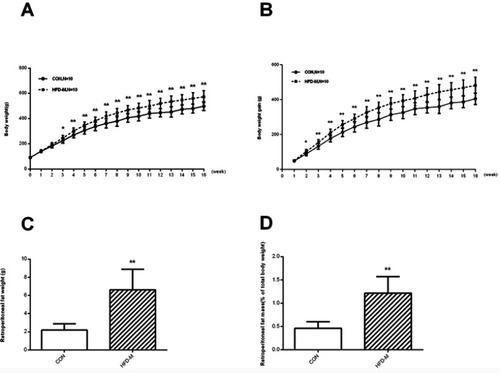
Table 1 The comparison of serum glucose and lipid metabolism measurements (mean±SD, n=10)
Figure 2 Effects of HFD-M on the expression of ER stress-related proteins in subcutaneous fat tissue of rats. (A) Representative GRP78, p-IRE1-α, p-JNK Western blots; Quantification of the Western blot membranes for (B) GRP78; (C) p-IRE1-α; (D) p-JNK. Data were presented as mean ± SD, n=6 each group; *P<0.05, **P<0.01.
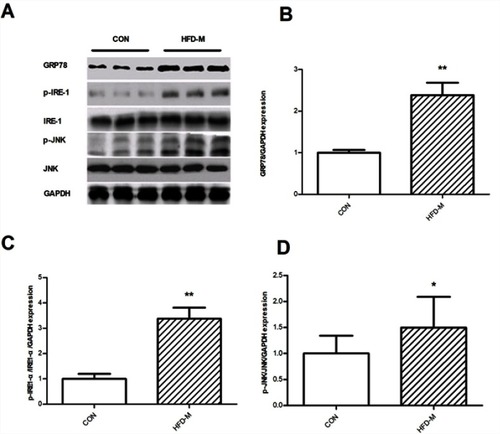
Figure 3 Effects of HFD-M on the expression of ER stress-related proteins in rat retroperitoneal fat tissue. (A) Representative GRP78, p-IRE1-α, p-JNK Western blots; Quantification of the Western blot membranes for (B) GRP78; (C) p-IRE1-α; (D) p-JNK. Data were presented as mean ± SD, n=6 each group; **P<0.01.
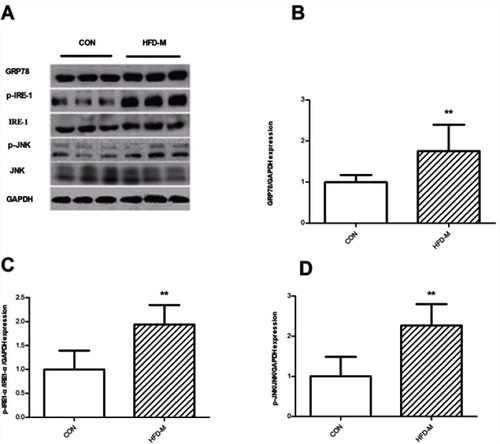
Figure 4 ER stress induced by EA in human mature adipocytes. (A) Control group; (B) treated with 100 μmol/L of EA for 24 hrs; (C) quantitative analysis of ER luminal diameter, as a surrogate marker for ER stress per cell using transmission electron microscope images. Results are representative averages of at least six images performed from three independent experiments and are displayed as mean ± SD. **P<0.01. White arrow shows the ER lumen.
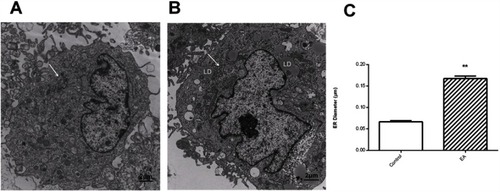
Figure 5 EA exposure activated markers of ER stress pathways in human adipocytes. (A) Representative GRP78, p-IRE1-α, p-JNK Western blots; quantification of the Western blot membranes for (B) GRP78; (C) p-IRE1-α; (D) p-JNK. Results are representative averages of at least three independent experiments and displayed as means ± SD. Compared to control group *P<0.05, **P<0.01; compared to EA-treated group, #P<0.05, ##P<0.01.
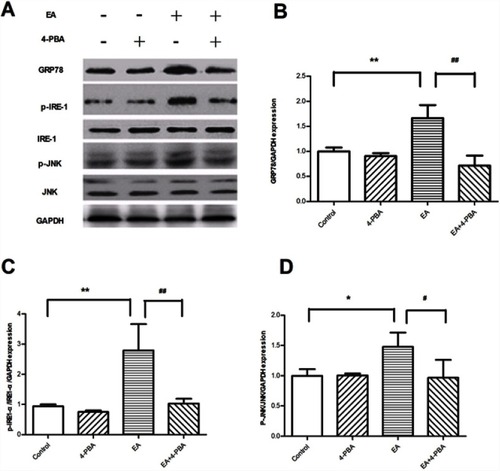
Figure 6 ER stress involves impaired insulin receptor signaling in human adipocytes. (A) Glucose uptake capacity; (n=6); (B) representative Western blots of GLUT4 and IRS-1 in human mature adipocytes; (C) quantification of the Western blot for GLUT4; (D) quantification of the Western blot for IRS-1. (n=3); *P<0.05 compared to control group. #P<0.05 compared to EA group.
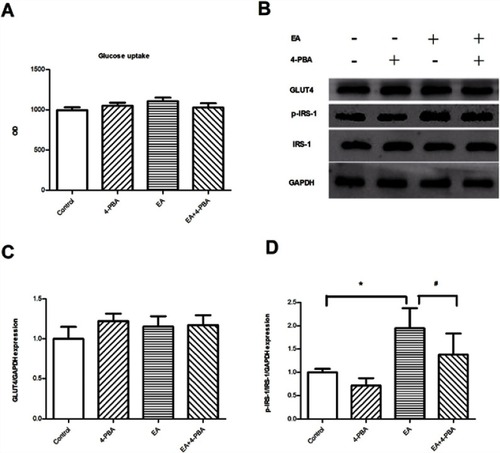
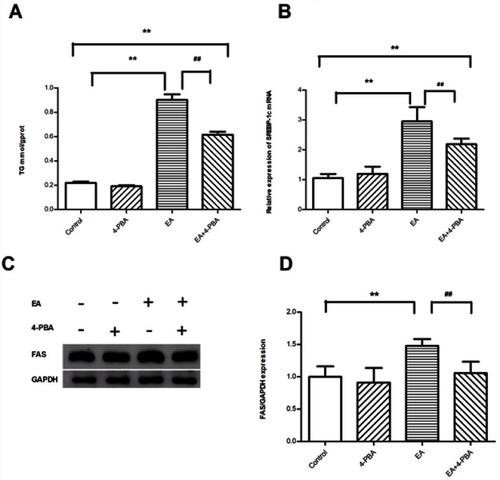
Figure 7 Effects of EA exposure on fat accumulation of human mature adipocytes. (A) TG content. (n=6); (B) relative expression of SREBP-1c mRNA. (n=6); (C) representative FAS Western blots. (D) Quantification of the Western blot membranes for FAS. (n=3); Data are presented as means ± SD; Compared to control group **P<0.01; compared to EA group ##P<0.01.