
Figures & data
Table 1 Main Epidemiological Studies on Insulin Autoimmune Syndrome (IAS)
Table 2 List of Medications Associated with the Development of Insulin Autoimmune Syndrome
Figure 1 The insulin autoimmune syndrome pathogenesis.
Notes: Panel (A) schematic overview of the physiologic insulin secretion and action: following glucose intake, pancreatic beta-cells secrete insulin which enters into the bloodstream, getting to peripheral tissues when it exerts its physiological functions in order to maintain glucose homeostasis. Panel (B) schematic overview of the double-phase mechanism of the insulin autoimmune syndrome. Following glucose intake, pancreatic beta-cells secrete insulin which enters into the blood stream getting included in the insulin-IAA macro-complexes. In the early postprandial phase, inclusion intro macro-complexes prevents insulin to act on its receptors in peripheral tissues, thus inducing hyperglycemia (phase 1). Due to the relatively low affinity for insulin, IAA subsequently release insulin molecules irrespective of plasma glucose concentrations, thus inducing hypoglycemic episodes (phase 2). Below both panels is reported a schematic representation of glucose and insulin concentrations over time: the continuous line represents plasma glucose concentrations, dotted line represents total insulin, pointed line represents free unbound insulin.
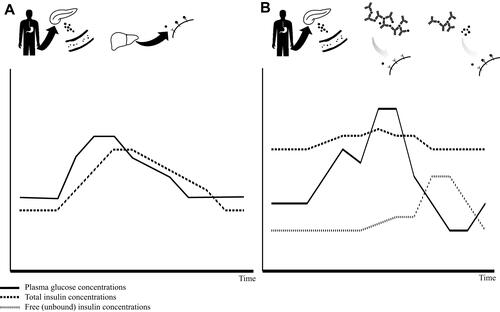
Figure 2 Flowchart for the diagnosis of insulin autoimmune syndrome.
Abbreviations: PEG, polyethylene glycol; IAA, insulin autoantibodies.
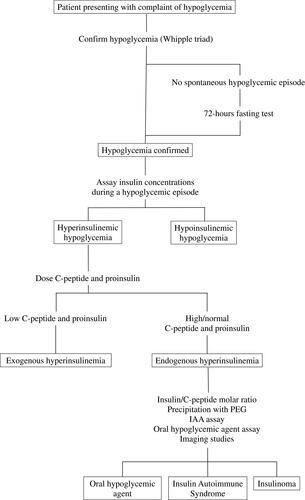
Table 3 Diagnostic Tools for the Differential Diagnosis Between Hypoglycemias of Different Origins