Figures & data
Table 1 Formula And Nutrient Of Normal And High-Fat Diets
Figure 1 Changes of body weight (A, B), blood glucose (C, D), and serum insulin (E, F) in mice of different groups before dietary intervention, after 6 weeks of HFD, and on GD 0, 10, and 18. Data are expressed as the mean ± SD values (n = 15). *P <0.05 vs CV group, #P <0.05 vs CP group.
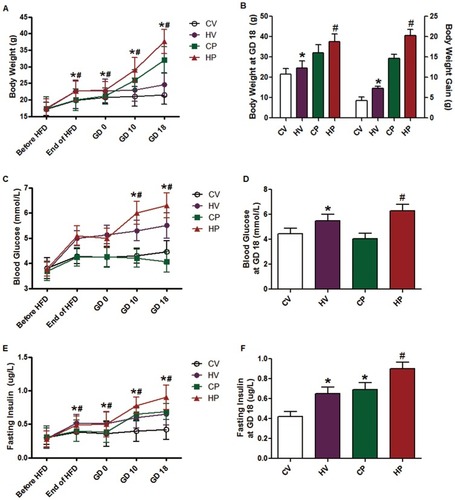
Figure 2 Glucose tolerance test. Blood glucose (A) and serum insulin levels (B) during intraperitoneal glucose tolerance test in the four groups after 6 weeks of HFD. Blood glucose (C) and serum insulin levels (D) during intraperitoneal glucose tolerance test in the four groups on GD 18. Area under the curve (AUC) of blood glucose and serum insulin was calculated. Data are expressed as the mean ± SD values (n = 15). #P <0.05, ##P <0.01 vs CP group.
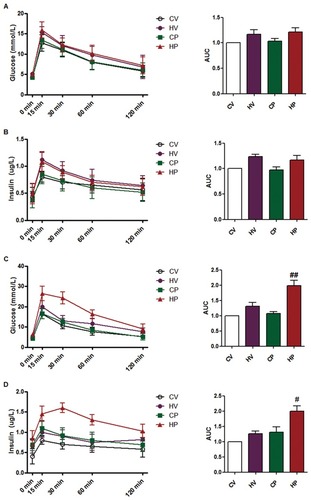
Figure 3 Reproductive outcome of pregnant mice. Litter size (A) and body weight at birth (B) of fetal mice by each female mouse from CP and HP experimental groups were recorded. Data are expressed as the mean ± SD values (n = 15). #P <0.05 vs CP group.
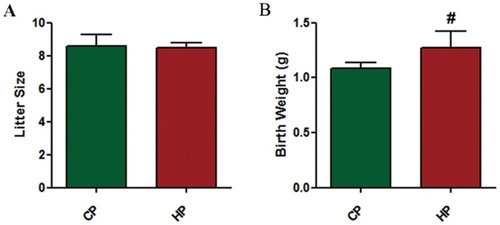
Figure 4 Changes of renal morphology. The kidney was stained with HE for morphologic analysis under light microscopy. Morphologic changes of glomeruli and renal tubules were observed under a high magnification field (× 400).
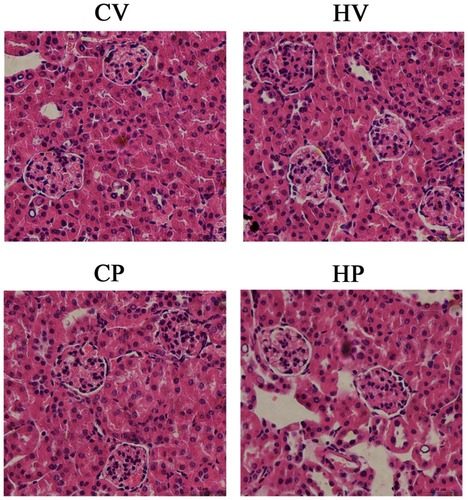
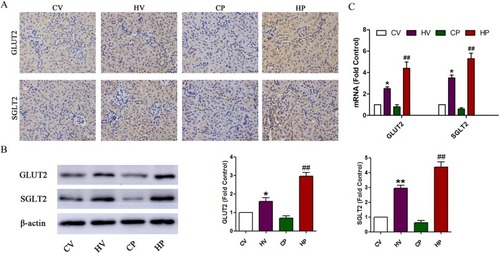
Figure 5 Changes of renal GLUT2 and SGLT2 levels. (A) Immunohistochemical staining of renal GLUT2 and SGLT2. Coronal kidney sections were stained with GLUT2 and SGLT2 antibodies and observed under a high magnification field (× 400). (B) Representative immunoblot and quantification of GLUT2 and SGLT2 in the kidney of mice from the four groups. (C) mRNA expression levels of GLUT2 and SGLT2 in the kidney of mice from the four groups. Data are expressed as the mean ± SD values (n = 15). *P <0.05, **P <0.01 vs CV group, ##P <0.01 vs CP group.